- All Instrument Types
- Indices
- Equities
- ETFs
- Funds
- Commodities
- Currencies
- Crypto
- Bonds
- Certificates
Please try another search

Opening Bell: U.S. Futures Pop On Fed Optimism; Europe, U.K., WTI Shine

- European shares, U.S. futures climb on expectations Fed sustains its dovish agenda
- Pound, FTSE 100 gain ground despite blocked vote on May's Brexit deal
- U.S. dollar slides for a third day
- WTI nears four-month high as OPEC+ defers production decision till June
- The Fed is expected to hold interest rates steady on Wednesday. It is also expected to announce it will stop rolling off assets from its balance sheet, and to lower projections for the number of rate hikes for the year.
- Central banks in Thailand, the Philippines and Indonesia are all scheduled for policy meetings this week.
- In the euro zone, PMI numbers out on Friday will give an indication on the health of the region’s industrial and service sectors at the end of the first quarter.
- FedEx (NYSE:FDX) is scheduled to report corporate results after market close on Tuesday, with forecasts of $3.14 EPS and $17.62 billion revenue.
- Micron Technology (NASDAQ:MU) is slated to announce earnings after market close on Wednesday. Analysts see a $1.66 earnings with a $5.86 billion revenue.
- Nike (NYSE:NKE) is expected to report earnings after market close on Thursday. Analysts forecast a $0.64 EPS on a $9.58 billion revenue.
- Tiffany & Co (NYSE:TIF) is expected to release earnings before market open on Friday, with a $1.6 EPS and $1.34 billion forecast.
- Futures on the S&P 500 hit the highest level in more than five months.
- The STOXX 600 reached the highest level in more than five months on its fifth consecutive advance.
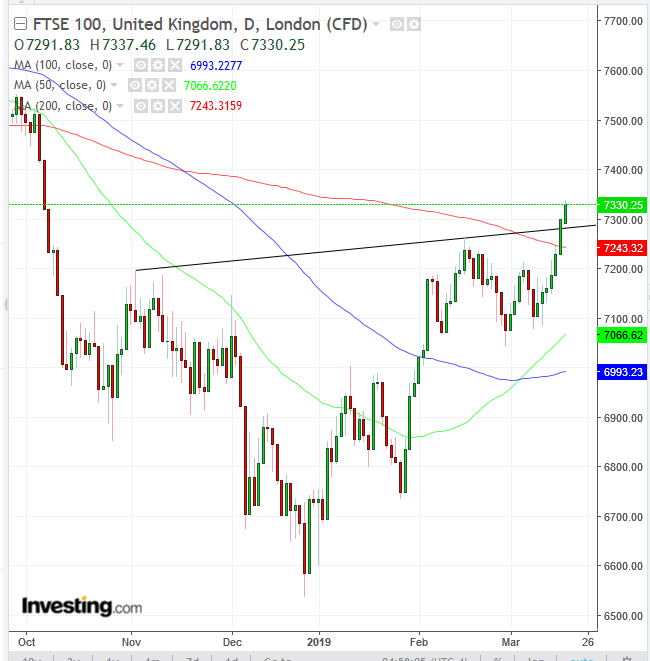
- The U.K.’s FTSE 100 jumped to the highest level in more than five months with its seventh consecutive advance.
- The MSCI Asia Pacific Index increased less than 0.05% to the highest in more than three weeks.
- The MSCI Emerging Market Index climbed 0.1% to the highest in more than seven months.
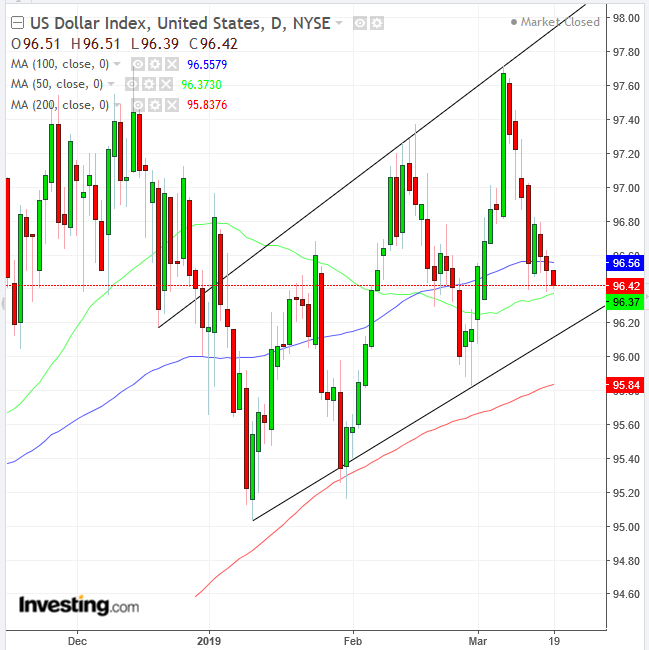
- The Dollar Index dropped 0.12% to the lowest in almost three weeks.
- The euro climbed 0.1% to $1.1354, the strongest in more than two weeks.
- The Japanese yen gained 0.1% to 111.29 per dollar.
- The yield on 10-year Treasurys fell one basis point to 2.59%.
- Germany’s 10-year yield fell less than one basis point to 0.08%, the largest fall in a week.
- Britain’s 10-year yield fell one basis point to 1.186%, the lowest in a week.
- Gold increased 0.1 % to $1,305.37 an ounce.
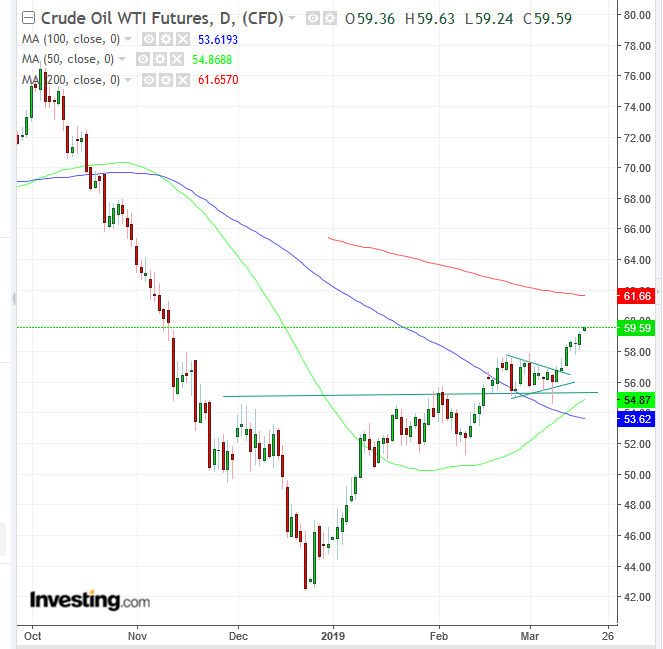
- West Texas Intermediate crude gained 0.1 % to $59.17 a barrel, the highest in more than four months.
Key Events
European stocks and futures on the S&P 500, Dow and NASDAQ 100 edged higher this morning, extending a rally to a fifth straight day on speculation the Fed will reinforce its recent dovish posture, following in the footsteps of China’s policy easing to reign in an economic downturn.
The STOXX Europe 600 opened 0.08% higher and extended the climb to over 0.6% by the late morning session, trading at the highest level since Oct. 4 and less than 1% below the Sept. 27 peak.
Meanwhile, U.K. Prime Minister Theresa May saw a vote on her Brexit deal, tentatively scheduled for this week, being blocked by Speaker of the House of Commons John Bercow, who announced yesterday the plan would have to be reworked before it can be put forward to parliament for approval.

The development didn’t seem to have a lasting adverse impact on British assets, with the pound rebounding from a post-announcement dip and the FTSE 100 climbing for the seventh consecutive session. Technically, the index extended an upside breakout through the 200 DMA and the neckline of a massive H&S bottom ranging from November.
In the earlier Asian session, most regional benchmarks slid lower amid thin trading, ahead of a potentially pivotal Fed meeting, in which policy makers could confirm, or deny, a policy shift toward accommodation.
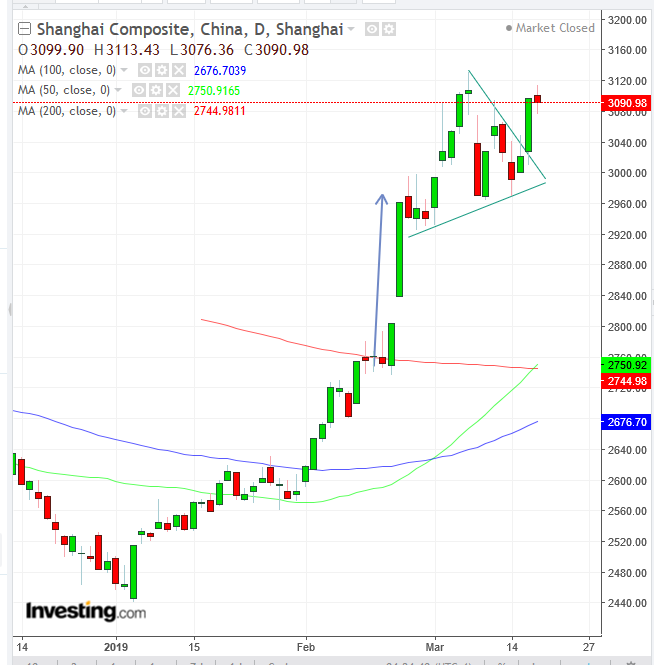
China's Shanghai Composite (-0.18%) underperformed. The decline was most likely driven by profit-taking after Monday’s 2.47% surge, which was prompted by Chinese officials' aggressive economic stimulus. The marginal setback was probably also caused by speculation the U.S. policymakers will channel the same dovishness as their Chinese counterparts, as the trade dispute between the two countries, which is at the center of a global slowdown, remains unresolved. Technically, the Chinese gauge may be correcting after an upside breakout of a pennant, bullish in an uptrend, especially after the 7.63% surge in the two days of Feb. 22 and Feb. 25 before the pattern development. Also, the 50 DMA crossed over the 200 DMA amid the pennant’s formation, triggering a Golden Cross.
Hong Kong’s Hang Seng (+0.19%) rebounded from an initial drop, which may also be due to profit-taking, after its 1.93% jump over the previous two sessions. However, Hong Kong shares are suffering from continued intervention, as the City’s monetary authority defend the HK dollar’s trading band peg to the USD, making local shares less attractive for foreign investors.
Japan’s Nikkei 225 gave back 0.08%, and both Australia’s S&P/ASX 200 and South Korea’s KOSPI inched down 0.09%.
Global Financial Affairs
In yesterday’s U.S. session, stocks extended last week’s rally. The S&P 500 added 0.37%, helped mainly by Energy (+1.39%), which tracked surging oil prices, Financials (+1.01%) and Industrials (+0.97%). Communication Services (-0.85%) held the index back from sealing more substantial gains. Technically, the SPX reached the highest level since Oct. 9, extending the short-term uptrend since the December bottom, while the medium-term trend remains trendless, potentially developing a H&S top or Broadening Pattern.
The NASDAQ Composite gained 0.34%.
The Dow Jones Industrial Average climbed 0.25%, underperforming its U.S. peers, while the Russell 2000 outperformed, gaining 0.67% and closing above the March 13 high—though it remained below the late February highs, guarded by the 200 DMA. Why would small caps outperform and mega caps lag, in a context of scarce trade developments?

Small-cap stocks tend to gain traction with higher inflation, as a strengthening USD poses a headwind to multinational companies. Perhaps, this ongoing negative correlation between mega- and small-cap shares may be a leading signal for rising inflation, and with it, for a strengthening dollar, even as the greenback is falling for the third day on Tuesday. Technically, the Dollar Index has reached the bottom of a congestion since Wednesday, above the bottom of an ascending channel, supported by the 200 DMA, suggesting the buck will, in fact, rise.
On the other hand, yields on 10-year Treasurys have completed a bearish pattern, after falling below their uptrend line since July 2016, potentially signaling that investors don’t, in fact, expect interest rates to rise, or they wouldn’t invest into newer bonds. Still, traders might consider Treasurys to be the lesser of two evils between bonds and equities, with the longest bull stock market in history entering its eleventh year and a slew of potential headwinds clouding its outlook.
Oil reached a near four-month high as OPEC+ producers decided to extend supply cuts till their June meeting, when they will revisit the subject. Saudi Arabia has in fact announced there won't be a summit in April, raising questions over the decision to delay discussions on output. Technically, U.S. crude climbed for the sixth day out of seven, after completing a pennant, following a H&S bottom. The next test would be the 200 DMA, above $61.
Up Ahead
Earnings
Market Moves
Stocks
Currencies
Bonds
Commodities
Related Articles

Economic resilience has held up, but emerging signs of weakness suggest investors should stay vigilant. Market volatility is creeping higher, hinting at a potential shift from...

Last week, we discussed that continued bullish exuberance and high levels of complacency can quickly turn into volatility. Over the previous week, the market fell sharply...

This week we got the second look at Q4 GDP, which showed the economy grew at a 2.3% annualized pace. Which was the same as the 1st estimate, but below the historical average of...
Are you sure you want to block %USER_NAME%?
By doing so, you and %USER_NAME% will not be able to see any of each other's Investing.com's posts.
%USER_NAME% was successfully added to your Block List
Since you’ve just unblocked this person, you must wait 48 hours before renewing the block.
I feel that this comment is:
Thank You!
Your report has been sent to our moderators for review


Add a Comment
We encourage you to use comments to engage with other users, share your perspective and ask questions of authors and each other. However, in order to maintain the high level of discourse we’ve all come to value and expect, please keep the following criteria in mind:
Enrich the conversation, don’t trash it.
Stay focused and on track. Only post material that’s relevant to the topic being discussed.
Be respectful. Even negative opinions can be framed positively and diplomatically. Avoid profanity, slander or personal attacks directed at an author or another user. Racism, sexism and other forms of discrimination will not be tolerated.
Perpetrators of spam or abuse will be deleted from the site and prohibited from future registration at Investing.com’s discretion.