


Sign up to create alerts for Instruments,
Economic Events and content by followed authors
Free Sign Up Already have an account? Sign In
Please try another search

Thursday March 2: Five things the markets are talking about
Fed-funds futures contracts suggest traders now expect the Fed to lift rates this month.
Currently, the market shows a +80% probability for an increase on March 15, more than double the probability accessed on Tuesday.
The market is also suggesting a +53% chance of three-rate increases by the end of the year, up from +42% yesterday.
The shift comes as Fed officials continue to hint more strongly this week that a move is increasingly “likely.” Helping the odds was U.S data yesterday, the Fed’s preferred gauge of inflation, PCE price index, is nearing its target annual rate of +2% (+1.9%).
Note: Fed’s Brainard (Dove, voter): ready to increase interest rates soon because of the improvement in global conditions and continuous growth, while Fed’s Kaplan (Moderate, voter): reiterated Fed should begin process of gradual rate hikes.
Fed Chair Yellen gives an address on the U.S economic outlook on Friday in Chicago.
1. Equities trade atop record levels
Regional bourses are not been left out; they too are willing to head towards the lofty record heights experienced by U.S indexes.
Overnight, Tokyo shares jumped to the highest since December 2015 after U.S. indexes set new records on signs growth is firming globally. Japan’s Topix climbed +0.8%, despite paring an earlier gain of as much as +1.4%.
Down-under, the Australia’s S&P/ASX 200 Index rose +1.3%, the most since November. While the Jakarta Composite Index jumped +1%, it’s biggest advance this year. Elsewhere, the Hang Seng erased gains after briefly topping the psychological 24,000 print.
In Europe, equity indices are trading mixed to lower, consolidating some of yesterday’s gains after a raft of corporate earnings pre-market, and as political concerns in France weigh. Financials are weighing Eurostoxx while commodity and mining stocks are providing some early support in the FTSE 100.
U.S stocks are set to open in the red (-0.1%).
Indices: Stoxx50 -0.2% at 3,381, FTSE -0.1% at 7,379, DAX -0.1% at 12,055, CAC 40 flat at 4,959, IBEX 35 -0.2% at 9,730, FTSE MIB flat at 19,363, SMI +0.1% at 8,644, S&P 500 Futures -0.1%

2. Oil down on record U.S crude stocks, gold resilient
Oil prices are under pressure Thursday after U.S crude stocks hit an all-time high and official data shows Russian oil production unchanged last month.
Ahead of the open, Brent crude oil is down -50c a barrel at +$55.86 while U.S light crude (WTI) is -45c lower at +$53.38.
Yesterday’s EIA data showed crude inventories stateside rose by +1.5m barrels last week to a record +520.2m.
Elsewhere, Russia’s oil output was unchanged in February at +11.11m barrels per day. Does this suggest that Moscow’s efforts to curb production as part of a global deal may be failing?
Nevertheless, crude prices remained locked within a tight trading range, supported by evidence of other OPEC production cuts by member states – they were +90% compliant in January.
Gold prices (-0.4% to +$1,245.11 an ounce) have slipped overnight as the dollar firmed on hawkish comments from U.S Fed officials that stoked expectations of a rate hike on March 15.
Note: The metal was at the highest level in more than three months last Friday, trading atop of +$1,263.80.

3. Bund yields ignore Eurozone inflation data
Bond investors appear to be ignoring this morning’s eurozone inflation data rallying above the ECB’s target for the first time in four-years (see below).
The yield on the Germany 10-Year Bund was recently at +0.294%, a tad higher day over day, but down from an intraday high of +0.306%. The market was prepared for the +2% inflation print for February after German annual inflation was reported at +2.2% yesterday. ECB’s Draghi and company are expected to look through this price rise driven by energy and food, allowing them to keep the current QE program intact.
Ahead of the U.S open, Yields on 10-Year Treasuries have backed up +2bps to +2.47%, after climbing +6bps Wednesday. Down-under, Aussie benchmark yields have slipped -2bps to +2.79%, while those in New Zealand have rallied +3bps to +3.32%.

4. Sterling weak and could get weaker
Prime Minister May’s government was dealt a setback from the House of Lords yesterday who voted to amend the Brexit bill to safeguard the right of all E.U nationals currently in the U.K.
The cabinet had hoped to convince the members of the Upper House to vote down the amendment, so as to keep the bill on track to trigger Article 50 by mid-March (dealers believe PM May was hoping March 15).
The bill now goes back to the Lower House, which may yet still have the bill passed on time to trigger Article 50 before the original date of the end of March.
Nevertheless, the amendment requires new legislation to be drawn up, making PM May’s schedule “very” tight.
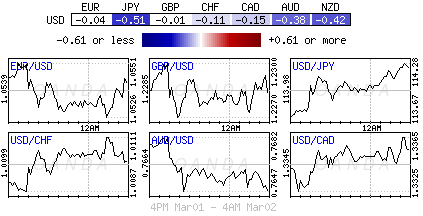
The net result is that GBP/USD (£1.2267) remains soft on a combination of a stronger dollar (rate differentials) and Brexit issues. A technical drop below £1.2250/55 could see the pound fall towards the psychological £1.20 handle and egged on by investors get jittery about the actual triggering of Article 50.

5. Euro Zone headline CPI at four-year high
The eurozone’s annual rate of inflation edged above the ECB’s target for the first time in four-years last month, jumping to +2.0%, up from +1.8% in January.
The increase is almost entirely down to faster rise in energy and food prices, with the “core” inflation measure stuck at +0.9%.
Data like this should leave the ECB unconvinced that inflation will stay around current levels after the rise in energy prices ends. Investors should not expect the ECB to alter their policy stance any time soon.
Note: The higher headline CPI data has done little to support the EUR (€1.0527) as the core readings remain subdued and locked in the 0.8-0.9% range since last May.
The US dollar fell last week due to Trump's inconsistent trade policies and signs of a slowing economy. February's non-farm payroll data disappointed, with unemployment...
Forex Strategy is Bearish: USD/JPY is currently at 146.76 in a 5th fractal wave in a channel. We are looking for a continuation to the ATR target at the 146.10 area, with a...
The Canadian dollar is steady at the start of the week. USD/CAD is trading at 1.4385, up 0.06% on the day. The Canadian dollar declined 0.50% on Friday after Canada’s job report...
Are you sure you want to block %USER_NAME%?
By doing so, you and %USER_NAME% will not be able to see any of each other's Investing.com's posts.
%USER_NAME% was successfully added to your Block List
Since you’ve just unblocked this person, you must wait 48 hours before renewing the block.
I feel that this comment is:
Thank You!
Your report has been sent to our moderators for review
Add a Comment
We encourage you to use comments to engage with other users, share your perspective and ask questions of authors and each other. However, in order to maintain the high level of discourse we’ve all come to value and expect, please keep the following criteria in mind:
Enrich the conversation, don’t trash it.
Stay focused and on track. Only post material that’s relevant to the topic being discussed.
Be respectful. Even negative opinions can be framed positively and diplomatically. Avoid profanity, slander or personal attacks directed at an author or another user. Racism, sexism and other forms of discrimination will not be tolerated.
Perpetrators of spam or abuse will be deleted from the site and prohibited from future registration at Investing.com’s discretion.