
- All Instrument Types
- Indices
- Equities
- ETFs
- Funds
- Commodities
- Currencies
- Crypto
- Bonds
- Certificates
Please try another search

Market Outlook: AUD/USD Shows Little Progress

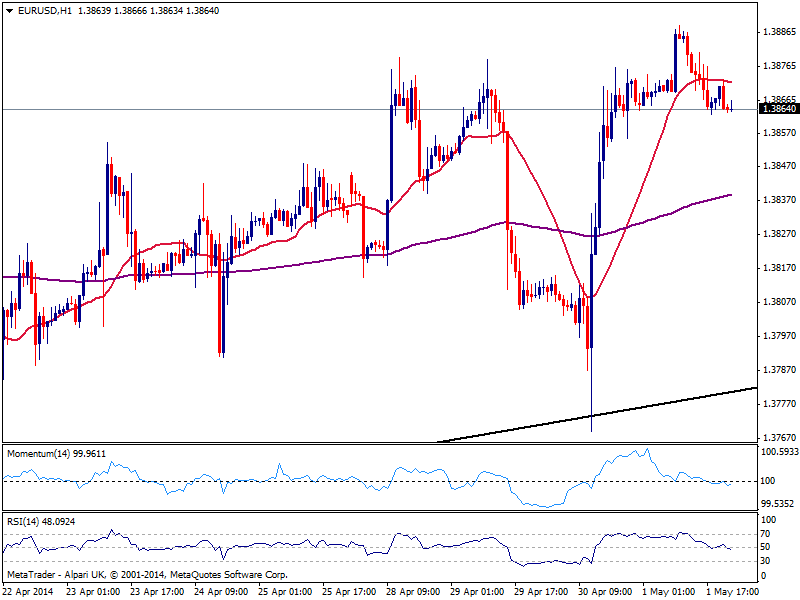
Thursday resulted in a pretty quiet day across the FX board, albeit both EUR and GBP managed to post higher highs for the week, and in fact when it comes to Pound for the year, leaving little room for dollar strength. As for the EUR/USD the pair reached a daily high of 1.3888, flirting with the static resistance level before retracing some, but maintaining the overall bullish trend. On Friday, the US will release its monthly employment figures, something that may interrupt technicals in the short term but will hardly weight in the longer one. Technically, the hourly chart shows price being capped now by a flat 20 MA at 1.3871, while indicators corrected extreme overbought readings and lay flat around their midlines. In the 4 hours chart technical readings lost the upward potential and stand in neutral territory, albeit price holds above its moving averages, reflecting bulls maintain the lead. Having flirted with 1.3890 early Europe, the level is the immediate resistance to break to confirm an upward continuation rally, while retracements will found buyers waiting in the 1.3800 price zone. A break above 1.3890 on the contrary, exposes the pair to an upward continuation towards 1.3966 this year high.
Support: 1.3840 1.3805 1.3770 1.3730
Resistance: 1.3890 1.3920 1.3966 1.4000
EUR/JPY
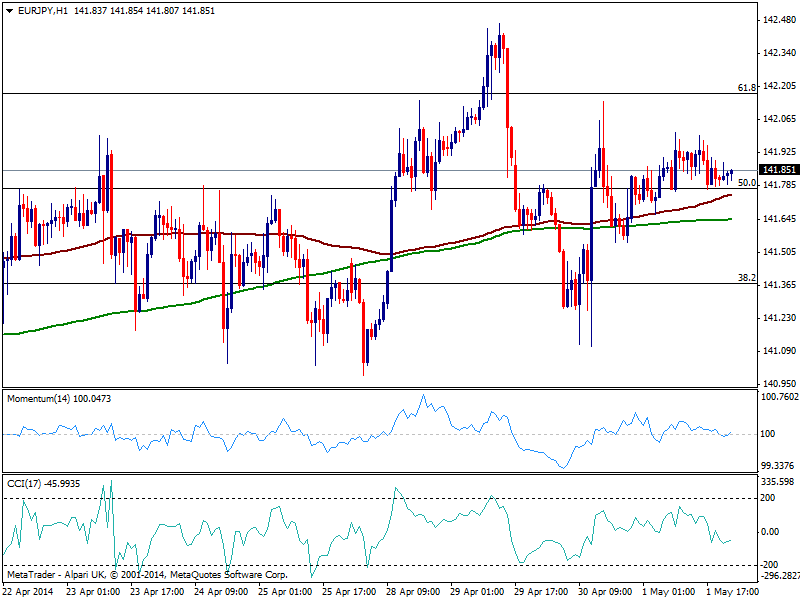
Wide range early week has done little for the pairs’ momentum, as the EUR/JPY trades barely 40 pips away from its weekly opening, clear reflection of the lack of longer term definitions as per now. In the short term, the hourly chart shows price finding short term Support: around the 50% retracement of the 143.47/140.07 bearish run, with indicators heading lower around their midlines, yet moving averages heading slightly higher below current price, all of which contains the downside. In the 4 hours chart the technical picture is mildly bearish with indicators heading south below their midlines, maintaining the pair exposed to the downside. Still a break below 141.30, 38.2% of the same rally is required to confirm a downward continuation in the short term. Bigger time frames present a neutral stance with price hovering around its 100 DMA since early April, another clear sign of absent trend.
Support: 141.60 141.30 140.90 140.40
Resistance: 142.20 142.50 143.00 143.45
GBP/USD
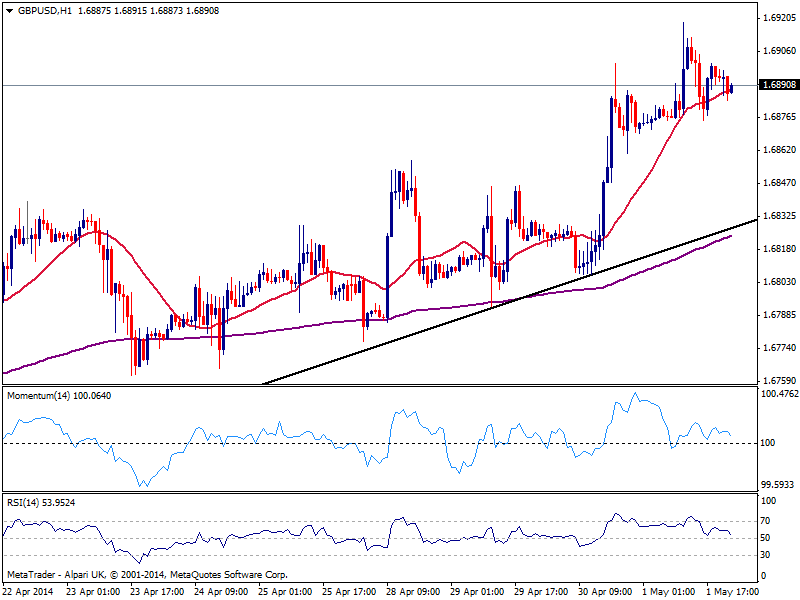
The GBP/USD posted a higher high for the year at 1.6918, although the lack of volume kept the pair range bound around the 1.6900 figure for the rest of the day. As a new day starts, the short term picture remains mildly bullish, with price holding above a slightly bullish 20 SMA, and indicators standing in positive territory albeit showing no actual strength. In the 4 hours chart technical readings present a stronger upward tone, Support:ive of the bullish dominant trend. A breach of mentioned high should lead to an advance up to critical 1.7000 figure, while above this last, next resistance stands at 1.7041, August 2009 monthly high. To the downside, the pair has a strong converge of readings around 1.3830/40 (20 SMA in the 4 hours chart plus an ascendant trend line coming from 1.6548 April low) and the most likely case is bulls reappearing in case of approaches to the area.
Support: 1.6835 1.6800 1.6770 1.6745
Resistance: 1.6920 1.6960 1.7000 1.7040
USD/JPY
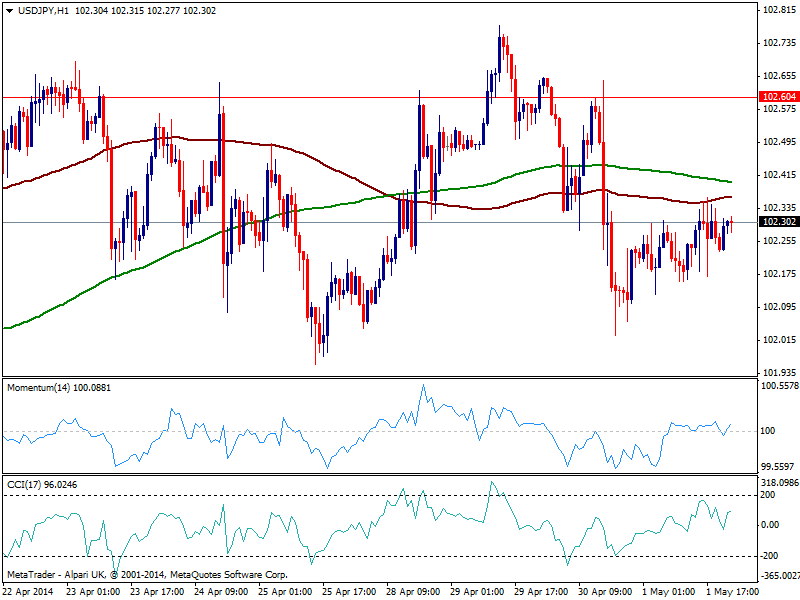
Unchanged from previous update, the USD/JPY has been confined to a 20 pips range this past Thursday, holding right in the middle of the 102.00 /102.60 range that contained the pair for most of these past weeks. Short term picture is slightly bearish, with price finding intraday resistance around its 100 SMA at 102.35 and indicators holding neutral around their midlines. In the 4 hours chart indicators head lower below their midlines, which keeps the risk to the downside. Overall, the downside is favored yet with US employment data anything is possible: the higher the surprise either way, the stronger will be the movement in the pair tomorrow, with a positive reading triggering a bullish run that will most likely extend above 102.60 resistance and near critical 103.00 figure.
Support: 102.00 101.60 101.20 100.75
Resistance: 102.35 102.60 102.95 103.20
AUD/USD
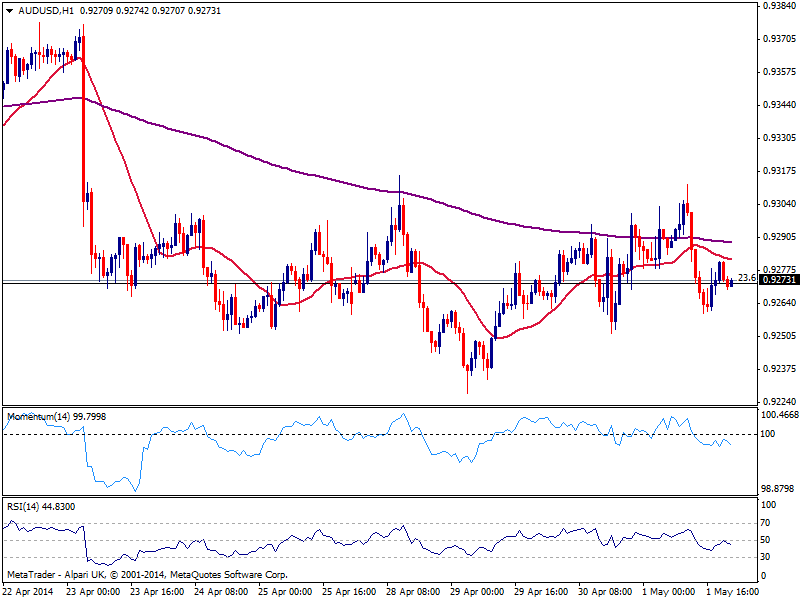
The AUD/USD has shown little progress over the past 24 hours, still stuck around the static Fibonacci level of 0.9275, 23.6% retracement of the 0.8677/0.9460 bullish rally from past March. In the short term, the hourly chart shows the mild bearish tone prevails as indicators head south below their midlines and price develops below its moving averages, while the 4 hours chart shows indicators aiming slightly higher around their midlines, which eases for now, the bearish pressure. 20 SMA in this last time frame converges with the Fibonacci level, while 200 EMA stands horizontal around 0.9240 offering immediate short term Support:. Sellers are still expected to surge on approaches to 0.9300, while the downside remains expose towards 0.9170 static Support: zone. Daily chart finally, shows an increasing bearish potential which favors a break lower towards 0.9160/70 price zone.
Support: 0.9240 0.9210 0.9170 0.9155
Resistance: 0.9300 0.9340 0.9380 0.9420
AUD/NZD
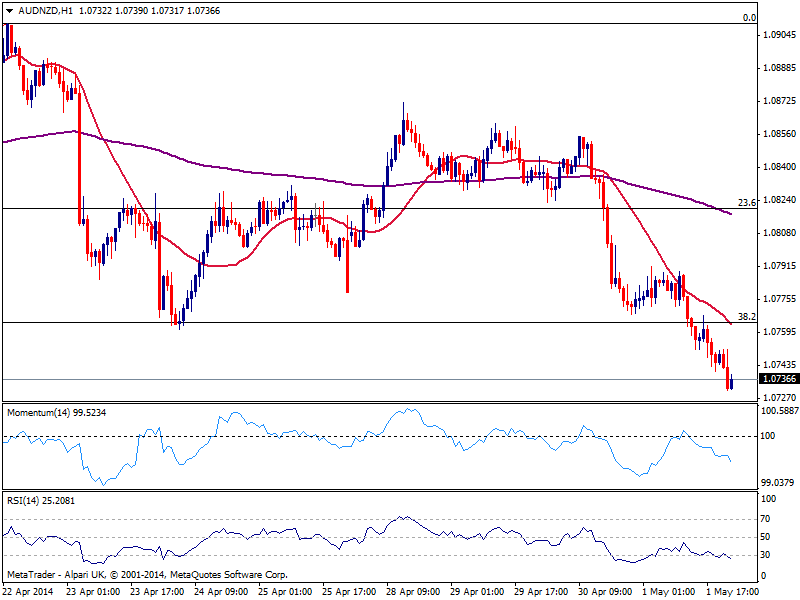
The AUD/NZD extended its bearish run down to 1.0731 fresh 4-week low. Still biased lower, the hourly chart shows price developing below a strongly bearish 20 SMA that converges with a critical Fibonacci level around 1.0765 the 38.2% retracement of the 1.0558/1.0910 rally, while indicators maintain a strong bearish momentum despite in oversold territory. In the 4 hours chart the bearish momentum remains quite strong, with price extending below 200 EMA key midterm resistance now around 1.0790. The immediate Support: comes a few pips below mentioned daily low, at 1.0720, 50% retracement of the mentioned rally. A break below exposes the downside towards 1.0670, 61.8% retracement. Gains beyond 1.0765 are unlikely for the upcoming sessions, yet if above, the pair would attempt to extend its rally up to 1.0790/1.0800 price zone.
Support: 1.0720 1.0695 1.0670 1.0525
Resistance: 1.0765 1.0790 1.0830 1.0870
XAU/USD
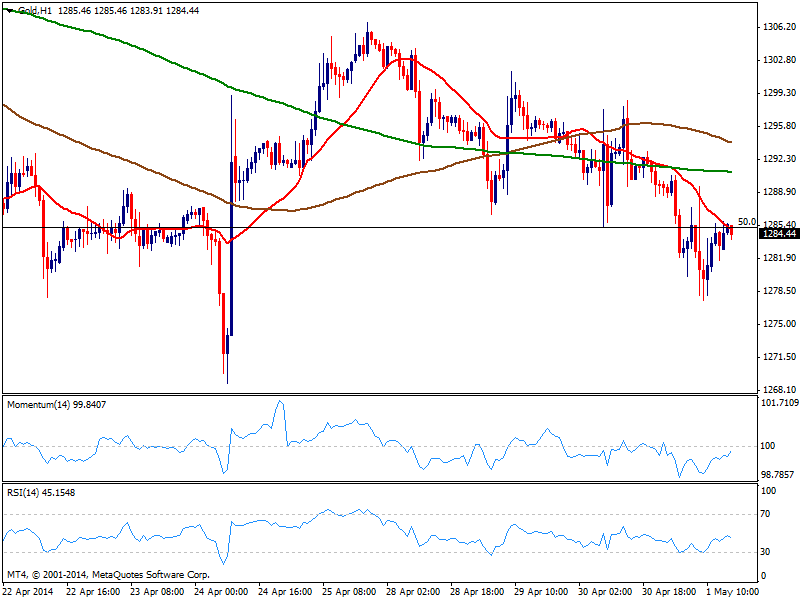
Gold ended up with losses for fourth day in a row, reaching an intraday low of 1277.53 and former recovering being contained by a Fibonacci resistance: the hourly chart shows price below its 20 SMA and the 50% retracement of this year bullish run at 1285.30 while indicators stand around their midlines diverging. In the 4 hours chart a stronger bearish tone is clear, as indicators turned lower below their midlines while 20 SMA gains bearish slope above current price offering dynamic resistance in the 1291.10 price zone. Bias remains to the downside, still looking for a test of 1268.90 April monthly low in the short term.
Support: 1280.45 1277.53 1268.90 1262.00
Resistance: 1291.40 1298.80 1306.70 1309.60
Related Articles
The GBP/USD has stabilized on Friday, after declining more than 1% a day earlier. In the European session, GBP/USD is currently trading at 1.2406, up 0.16% on the day. The US...

USD/CAD holds short-term range ahead of ISM manufacturing PMI. Bulls lose power but not the battle, uptrend intact above 1.4260. USD/CAD is in a wait and see mode. USD/CAD is...

The first trading day of the year brought fresh pressure on European currencies. There is now a considerable risk premium being built into EUR/USD, and we suspect that both...
Are you sure you want to block %USER_NAME%?
By doing so, you and %USER_NAME% will not be able to see any of each other's Investing.com's posts.
%USER_NAME% was successfully added to your Block List
Since you’ve just unblocked this person, you must wait 48 hours before renewing the block.
I feel that this comment is:
Thank You!
Your report has been sent to our moderators for review



Add a Comment
We encourage you to use comments to engage with other users, share your perspective and ask questions of authors and each other. However, in order to maintain the high level of discourse we’ve all come to value and expect, please keep the following criteria in mind:
Enrich the conversation, don’t trash it.
Stay focused and on track. Only post material that’s relevant to the topic being discussed.
Be respectful. Even negative opinions can be framed positively and diplomatically. Avoid profanity, slander or personal attacks directed at an author or another user. Racism, sexism and other forms of discrimination will not be tolerated.
Perpetrators of spam or abuse will be deleted from the site and prohibited from future registration at Investing.com’s discretion.