


Sign up to create alerts for Instruments,
Economic Events and content by followed authors
Free Sign Up Already have an account? Sign In
Please try another search

Shares of Xilinx Inc. (NASDAQ:XLNX) rallied during yesterdays’ after-hour trade, after the chipmaker announced overwhelming third-quarter fiscal 2018 results, wherein its earnings and revenues, both, came ahead of the respective Zacks Consensus Estimate. Moreover, the company beat its guidance at every point.
Xilinx reported fiscal third-quarter non-GAAP earnings (excluding one-time items and tax expense due to the enactment of recent Tax Cut and Jobs Act of 2017) of 76 cents per share, beating the Zacks Consensus Estimate of 63 cents. The figure surged 46.2% from the year-ago quarter and 16.9% from the previous quarter.
Revenues for the quarter came in at $631.2 million, which is above the mid-point of its guidance range of $615-$645 million (mid-point $630 million), as well as surpassed the Zacks Consensus Estimate of $630 million.
Investors’ optimism about the stock has been mainly boosted by some huge accomplishment achieved by Xilinx. The highlight of the quarter was attaining record quarterly sales figure, the ninth straight quarter of revenue growth and reaching 30% of operating margin target well ahead of time.
Xilinx, Inc. Price, Consensus and EPS Surprise
Advanced Products Drive Top-Line Growth
Management noted that Xilinx’s revenues increased for the ninth consecutive quarter, reflecting product strength. This uptick was primarily driven by robust performance of the company’s 16nm, 20nm and 28nm products.
Product wise, Advanced product revenues jumped a whopping 30% year over year and 10% sequentially. We note that the segment’s contribution to total revenues was 56%, a significant increase from 47% in the year-ago quarter and 52% reported in the previous quarter.
The robust performance of Advanced products was mainly driven by solid demand for its Zynq SoC platform and 20-nm and 16-nm nodes. Revenues from the Zynq SoC platform recorded 40% year-over-year growth, backed by robust demand in all of the company’s end markets, i.e. automotive, industrial, wireless and consumer.
The 20-nm sales soared 70% year over year in the reported quarter, chiefly driven by strength in multiple end markets. However, Xilinx noted that the 16-nm was the top performer in the quarter, registering over four-fold jump in revenues. The company shipped 43 unique products to more than 1,160 discrete customers across all end markets.
Revenues from core products declined 12% from the year-earlier quarter and 7% sequentially.
On basis of the End Market, Communications & Data Center segment revenues (35% of total revenues) dipped 12% year over year and 2% sequentially. The industrial, Aerospace & Defense segment revenues (47% of total revenues) climbed 23% on a year-over-year basis and 7% on a sequential basis. The broadcast, Consumer & Automotive revenues (18% of total revenues) ascended 24% year over year, but declined 3% sequentially.
Geographically, the company registered year-over-year growth in every region. Revenues from North America, Europe, Japan and Asia Pacific were up 12%, 11%, 10% and 3%, respectively. Nevertheless, sequentially, Japan was weak, declining 8%. This was fully offset by robust growth from North America, Asia Pacific and Europe, which advanced 3%, 3% and 2%, respectively.
Product Strength: Key Catalyst
Xilinx’s ongoing transition from a FPGA provider to an all-programmable devices producer has been helping the company gain market share. Its expanding product portfolio, which includes the Zynq RFSoC platform, is assisting it to counter intense competition from the likes of Intel (NASDAQ:INTC) . The company’s Zynq portfolio, which is implemented in both the 28-nm and 16-nm node, delivered sturdy top-line growth in the quarter.
Xilinx noted that it started shipping of the 16-nm RFSoC Silicon In-house family of product in the fiscal second quarter, which offers a superior architectural solution to 5G wireless with integrated RF-class analog technology. The product facilitates reduction of power consumption (50-75%), as well as footprint reduction for future 5G deployments, cable and wireless backhaul applications.
Management is also optimistic over the demand of its Ultrascale+ FPGAs data-center operators for providing FPGA-as-a-Service. Amazon (NASDAQ:AMZN) was the first to use Xilinx chips and started offering FPGA-as-a-Service in May 2017.
Since then, the company has got five contracts for FPGA-as-a-Service deployments, which, however, haven’t come online yet. The list, which includes the likes of Alibaba (NYSE:BABA) , is in the process to deploy two generations of FPGA-as-a-Service by using Xilinx’s Ultrascale+ FPGA chips.
Operational Details
Gross margin expanded 150 basis points (bps) year over year to 71.1% and 90 bps sequentially, and came in above the company’s guided range of 69-71%.
Operating expenses flared up 6.1% year over year and 3.9% sequentially to $259.3 million. Nonetheless, the figure came in lower than the company’s guidance of $260 million. As a percentage of revenues, operating expenses amounted to 41.1%, reflecting contraction of 60 bps on a year-over-year basis, but expansion of 80 bps sequentially.
Reduced operating expenses as a percentage of revenues, along with healthy revenue growth and improved gross margin, resulted in year-over-year expansion of 230 bps in operating margin, which came in at 30.1%. On a sequential basis, operating margin improved 20 bps, mainly driven by higher gross margin. Additionally, the company noted that it has achieved its goal of attaining 30% in operating margin one quarter ahead.
In dollars, the company posted operating income of $189.7 million, up 16.4% year over year and 2.4% sequentially.
The company’s net income came in at $11.9 million, significantly lower than $141.8 million reported in the year-ago quarter, and $167.5 million posted in the fiscal second quarter. The decline was mainly due to a one-time tax expense of approximately $183 million resulting from “the recent enactment of Tax Cut and Jobs Act of 2017”.
Excluding this and other one-time items, non-GAAP net income summed $200.6 million, marking year-over-year growth of 40% and 19.8% sequentially.
Balance Sheet, Cash Flow & Shareholders’ Return
Xilinx exited the reported quarter with cash and cash equivalents of approximately $3.54 billion compared with $3.56 billion recorded in the previous quarter. The company has total long-term debt (excluding current portion) of about $1.73 billion, down from $1.74 billion at the end of the prior quarter.
Xilinx generated cash of $184.7 million from operations and incurred $6.8 million as capital expenditure during the third quarter. The company paid $89.5 million in dividends and repurchased approximately 1 million shares for $73.3 million.
In the first three quarters of fiscal 2018, the company generated cash of $577.7 million from operations and incurred $28.9 million as capital expenditure. It paid $263.8 million in dividends and repurchased approximately 4.6 million shares for $310.8 million.
Guidance
For fourth-quarter fiscal 2018, Xilinx projects revenues in the range of $635-$665 million (mid-point $650 million). The mid-point of the company’s guidance range is currently higher than the Zacks Consensus Estimate of $642.2 million.
Management projects growth in the Advanced Products segment. Xilinx anticipates the Broadcast, Consumer & Automotive, Communications and the data-center end market to improve year over year. On the other hand, the Industrial and Aerospace & Defense end markets are estimated to remain flat.
Gross margin is anticipated to be between 69% and 71%. Operating expenses are likely to decrease to $255 million. During the quarter, Xilinx expects to incur a one-time expense of approximately $30 million due to CEO transition. Tax rate is projected between 0% and 5%.
The company remains focused on achieving its fiscal 2018 revenue target of approximately $2.5 billion.
Our Take
Xilinx is set to capitalize on the global trend of FPGA replacing application-specified integrated circuits (ASICs). There are certain fundamental advantages of using FPGAs over low-cost ASICs. One of the basic reasons is the difficulty in getting suitable ASICs for design and the additional cost of re-certifying new ASIC-based designs.
We expect FPGA products to drive the company’s revenues throughout fiscal 2018, aided by steady demand in the communications industry, and continued strong adoption of its products in Automotive, ISM, Test and Aerospace and Defense markets. Moreover, design wins from other sectors, such as wired communication, data center and industrial, will stoke revenue growth.
Furthermore, FPGAs are widely used in third generation (3G) and fourth generation long-term evolution (4G LTE) network connections. These markets are strongly co-related with global GDP growth and spending behavior.
Most of the emerging economies are witnessing unprecedented demand for mobile devices like smartphones and tablets, and also getting increasingly connected via the Internet. This has compelled these countries to heavily invest in the Telecom & Wireless infrastructure. We believe higher wireless deployments across the world will lead to heightened demand for Xilinx’s 16-nm, 20-nm and 28-nm nodes, thereby positively influencing its overall financial performance for the next few quarters.
Nonetheless, the company’s two biggest markets, India and China, are still facing the challenge of slow wireless deployments, which makes us slightly cautious about its Communication business.
Currently, Xilinx carries a Zacks Rank #3 (Hold).
You can see the complete list of today’s Zacks #1 Rank (Strong Buy) stocks here.
Today's Stocks from Zacks' Hottest Strategies
It's hard to believe, even for us at Zacks. But while the market gained +18.8% from 2016 - Q1 2017, our top stock-picking screens have returned +157.0%, +128.0%, +97.8%, +94.7%, and +90.2% respectively.
And this outperformance has not just been a recent phenomenon. Over the years it has been remarkably consistent. From 2000 - Q1 2017, the composite yearly average gain for these strategies has beaten the market more than 11X over. Maybe even more remarkable is the fact that we're willing to share their latest stocks with you without cost or obligation.
See Them Free>>
The S&P 500 had started to clear resistance, posting new all-time highs before sellers struck with a vengeance. The selling was bad, similar to that seen in December, which...
Myself and others have highlighted how European Equities have been breaking out to new all-time highs on the back of bullish factors such as cheap valuations, monetary tailwinds,...
Despite the Nasdaq 100’s earlier single-day loss of -3% on 27 January inflicted by Chinese Artificial Intelligence (AI) start-up DeepSeek’s cutting-edge capabilities with lower...
Are you sure you want to block %USER_NAME%?
By doing so, you and %USER_NAME% will not be able to see any of each other's Investing.com's posts.
%USER_NAME% was successfully added to your Block List
Since you’ve just unblocked this person, you must wait 48 hours before renewing the block.
I feel that this comment is:
Thank You!
Your report has been sent to our moderators for review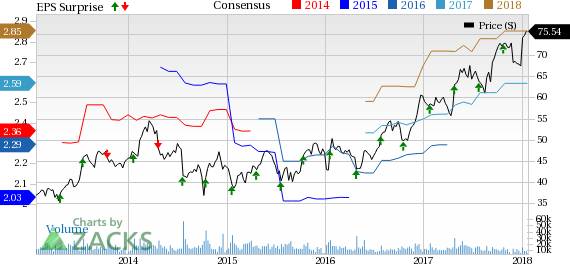

Add a Comment
We encourage you to use comments to engage with other users, share your perspective and ask questions of authors and each other. However, in order to maintain the high level of discourse we’ve all come to value and expect, please keep the following criteria in mind:
Enrich the conversation, don’t trash it.
Stay focused and on track. Only post material that’s relevant to the topic being discussed.
Be respectful. Even negative opinions can be framed positively and diplomatically. Avoid profanity, slander or personal attacks directed at an author or another user. Racism, sexism and other forms of discrimination will not be tolerated.
Perpetrators of spam or abuse will be deleted from the site and prohibited from future registration at Investing.com’s discretion.