


Sign up to create alerts for Instruments,
Economic Events and content by followed authors
Free Sign Up Already have an account? Sign In
Please try another search

A month has gone by since the last earnings report for Quality Systems, Inc. (NASDAQ:QSII) . Shares have lost about 7.5% in that time frame, underperforming the market.
Will the recent negative trend continue leading up to its next earnings release, or is QSII due for a breakout? Before we dive into how investors and analysts have reacted of late, let's take a quick look at its most recent earnings report in order to get a better handle on the important drivers.
Recent Earnings
Quality Systems reported fiscal third-quarter 2018 adjusted earnings per share of 15 cents, in line with the Zacks Consensus Estimate. However, adjusted earnings per share declined 34.8% on a year-over-year basis.
Revenues for third-quarter fiscal 2018 totaled $131.7 million, which marginally beat the Zacks Consensus Estimate of $131 million. Additionally, revenues increased 3% on a year-over-year basis.
Segment Details
Total Software, Hardware and Related: Revenues in this segment declined 4.3% on a year-over-year basis, amounting to $37.82 million. Subscription revenues of $24.7 million increased 10% year over year.
Support and Maintenance: Revenues improved 1.1% on a year-over-year basis, to $40.36 million. However, the figure declined sequentially.
Professional Services: Revenues in this segment increased 29% on a year-over-year basis to $8.5 million.
Electronic Data Interchange: Revenues in this segment grew 6.2% year over year to $23.1 million.
Revenue Cycle Management: Revenues in this segment increased 9.3% year over year to $21.9 million. In the reported quarter, nine new RCM deals were signed, of which two were entirely new clients to the company as a whole.
Quarter Highlights
EagleDream Acquisition: A Major Positive
Recently, Quality Systems acquired EagleDream, a software analytics solutions company. It was incorporated in the company’s operations in the third quarter of fiscal 2018. During the quarter, the company closed 10 deals across a broad product spectrum of accounts, both by specialty and geography. It has also led to a swift uptake in interest from the company’s user base around EagleDream. Thus, Quality Systems witnesses deal flow and significant interest from the integration of EagleDream.
Bookings Strengthen
A sequential 17% increase in bookings majorly drove sales in the reported quarter, which amounted to 30.5 million.
Interoperability Framework
The company’s framework is suitable for its software to exchange and make use of the information. Per management, the company had more than 100 clients integrated into the national care quality framework for interoperability, as of Dec 31. Further, more clients are being added each month post the upgrade. It ensures that patient data is transportable not just within the company database, but also across the industry.
Margin Details
Gross profit for the third quarter totaled $70.1 billion and gross margin is at 53.2%. Gross margin declined 429 basis points on a year-over-year basis. The decline is mainly due to a general shift to lower margin subscription revenues.
RCM margins are too compressed as the company invested for future efficiencies and witnessed some headwinds this quarter from personnel expenses.
Operating expenses surged due to investment in sale and marketing as well as acquisitions, partially.
Financial Condition
The company exited the third quarter with 23.4 million in cash and equivalents and 39 million in outstanding against revolving credit agreement at the end of the quarter. Quality Systems continues to be well positioned in terms of financial flexibility with 189 million available in total liquidity.
How Have Estimates Been Moving Since Then?
Analysts were quiet during the last month as none of them issued any earnings estimate revisions.
Quality Systems, Inc. Price and Consensus
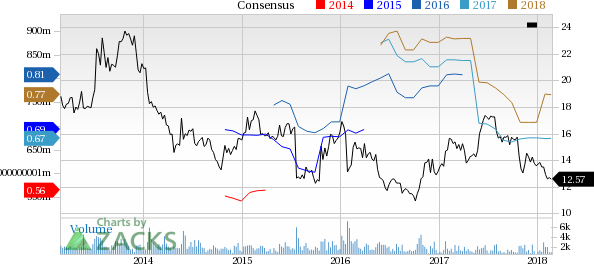
Quality Systems, Inc. Price and Consensus | Quality Systems, Inc. Quote
VGM Scores
Currently, QSII has a nice Growth Score of B, though it is lagging a lot on the momentum front with a D. The stock was allocated a grade of A on the value side, putting it in the top 20% for this investment strategy.
Overall, the stock has an aggregate VGM Score of B. If you aren't focused on one strategy, this score is the one you should be interested in.
Our style scores indicate that the stock is more suitable for value investors than growth investors.
Outlook
QSII has a Zacks Rank #3 (Hold). We expect an in-line return from the stock in the next few months.
The S&P 500 had started to clear resistance, posting new all-time highs before sellers struck with a vengeance. The selling was bad, similar to that seen in December, which...
Myself and others have highlighted how European Equities have been breaking out to new all-time highs on the back of bullish factors such as cheap valuations, monetary tailwinds,...
Despite the Nasdaq 100’s earlier single-day loss of -3% on 27 January inflicted by Chinese Artificial Intelligence (AI) start-up DeepSeek’s cutting-edge capabilities with lower...
Are you sure you want to block %USER_NAME%?
By doing so, you and %USER_NAME% will not be able to see any of each other's Investing.com's posts.
%USER_NAME% was successfully added to your Block List
Since you’ve just unblocked this person, you must wait 48 hours before renewing the block.
I feel that this comment is:
Thank You!
Your report has been sent to our moderators for review
Add a Comment
We encourage you to use comments to engage with other users, share your perspective and ask questions of authors and each other. However, in order to maintain the high level of discourse we’ve all come to value and expect, please keep the following criteria in mind:
Enrich the conversation, don’t trash it.
Stay focused and on track. Only post material that’s relevant to the topic being discussed.
Be respectful. Even negative opinions can be framed positively and diplomatically. Avoid profanity, slander or personal attacks directed at an author or another user. Racism, sexism and other forms of discrimination will not be tolerated.
Perpetrators of spam or abuse will be deleted from the site and prohibited from future registration at Investing.com’s discretion.