


Sign up to create alerts for Instruments,
Economic Events and content by followed authors
Free Sign Up Already have an account? Sign In
Please try another search

A month has gone by since the last earnings report for Flex Ltd. (NASDAQ:FLEX) . Shares have lost about 4.5% in the past month, underperforming the market.
Will the recent negative trend continue leading up to its next earnings release, or is FLEX due for a breakout? Before we dive into how investors and analysts have reacted as of late, let's take a quick look at its most recent earnings report in order to get a better handle on the important drivers.
Recent Earnings
Flex reported third-quarter fiscal 2018 non-GAAP earnings of 31 cents per share, which beat the Zacks Consensus Estimate of 30 cents but declined 8.8% from the year-ago quarter.
Revenues increased 10.4% from the year-ago quarter to $6.75 billion. Moreover, revenues surpassed the higher end of the guided range by $50 million and beat the Zacks Consensus Estimate of $6.49 billion.
The year-over-year revenue growth can be attributed to robust performance across most segments. The top line benefited from new business wins driven by the Sketch-to-Scale initiative as well as continued development of the long-term strategic partnership with Nike (NYSE:NKE).
Quarter Details
Communications & Enterprise Compute (CEC) revenues declined 5.9% from the year-ago quarter to almost $2.00 billion. The company continued to expand its datacenter capabilities during the quarter.
Consumer Technologies Group (CTG) revenues improved 11.2% from the year-ago quarter to $2.01 billion.
Revenues from the IEI segment were $1.49 billion, which surged 30.7% on a year-over-year basis. The segment benefited from robust demand across its diversified markets as well as the beginning of several Sketch-to-Scale programs.
HRS revenues were up a robust 19.7% from the year-ago quarter to $1.23 billion.
Operating Details
Adjusted gross margin contracted 40 basis points (bps) to 6.7% in the quarter.
Adjusted selling, general & administrative (SG&A) expenses were $232 million, up year over year. However, as a percentage of net sales, SG&A expenses declined 20 bps to 3.4%, primarily due to increasing design and engineering cost. Moreover, higher level of investment and under-absorbed overhead costs increased expenses.
Non-GAAP operating margin declined roughly 40 bps but expanded 30 bps sequentially to 3.3%.
Segment wise, CEC generated $50 million in adjusted operating profit and recorded adjusted operating margin of 2.5%.
CTG raked in $39 million in adjusted operating profit, resulting in an adjusted operating margin of 1.9%, a tad lower than the guided range of 2–4%. Sequentially, operating profit surged more than 26% primarily due to operational improvements related to the Nike partnership. However, lower contribution from new programs kept margins under pressure.
IEI reported $61 million in adjusted operating profit and 4.1% adjusted operating margin, within the targeted range of 4-6%.
HRS reported $101 million in adjusted operating profit, resulting in adjusted operating margin of 8.2%.
Balance Sheet & Cash Flows
As of Dec 31, 2017, cash & cash equivalents were $1.29 billion compared with $1.37 billion as of Sep 29, 2017. Total debt was $2.94 billion compared with $2.96 billion as of Sep 29, 2017.
Flex generated net cash from operations of $150 million compared with $142 million in the previous quarter. Free cash outflow was $11 million compared to free cash flowof $34 million in the previous quarter due to increased technology investments.
The company bought back roughly 2 million shares worth $35 million in the third quarter.
Guidance
For fourth-quarter fiscal 2018, revenues are expected to be in the range of $6.10–$6.50 billion. The company expects CTG, IEI and HRS to grow 5-10%, 15-25% and 10-20%, respectively, on a year-over-year basis. However, CEC is expected to decline between 5% and 10% year over year.
Adjusted operating income is anticipated in the range of $200–$230 million. Moreover, adjusted earnings are expected between 28 and 32 cents per share.
With a view to enable the company efficiently capitalize marketplace opportunities, management attempts to complete restructuring activities during its final quarter of fiscal 2018. It will cost the company a minimum of $50 million in the fourth quarter.
Flex remains committed to return more than 50% of annual free cash flow to shareholders.
How Have Estimates Been Moving Since Then?
Fresh estimates followed an upward path over the past two months.
VGM Scores
Currently, FLEX has an average Growth Score of C, though it is lagging a lot on the momentum front with an F. However, the stock was also allocated a grade of A on the value side, putting it in the top quintile for this investment strategy.
Overall, the stock has an aggregate VGM Score of B. If you aren't focused on one strategy, this score is the one you should be interested in.
Our style scores indicate that the stock is more suitable for value investors than growth investors.
Outlook
FLEX has a Zacks Rank #3 (Hold). We expect an in-line return from the stock in the next few months.
The S&P 500 had started to clear resistance, posting new all-time highs before sellers struck with a vengeance. The selling was bad, similar to that seen in December, which...
Myself and others have highlighted how European Equities have been breaking out to new all-time highs on the back of bullish factors such as cheap valuations, monetary tailwinds,...
Despite the Nasdaq 100’s earlier single-day loss of -3% on 27 January inflicted by Chinese Artificial Intelligence (AI) start-up DeepSeek’s cutting-edge capabilities with lower...
Are you sure you want to block %USER_NAME%?
By doing so, you and %USER_NAME% will not be able to see any of each other's Investing.com's posts.
%USER_NAME% was successfully added to your Block List
Since you’ve just unblocked this person, you must wait 48 hours before renewing the block.
I feel that this comment is:
Thank You!
Your report has been sent to our moderators for review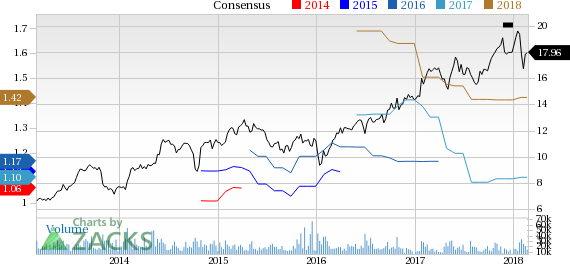

Add a Comment
We encourage you to use comments to engage with other users, share your perspective and ask questions of authors and each other. However, in order to maintain the high level of discourse we’ve all come to value and expect, please keep the following criteria in mind:
Enrich the conversation, don’t trash it.
Stay focused and on track. Only post material that’s relevant to the topic being discussed.
Be respectful. Even negative opinions can be framed positively and diplomatically. Avoid profanity, slander or personal attacks directed at an author or another user. Racism, sexism and other forms of discrimination will not be tolerated.
Perpetrators of spam or abuse will be deleted from the site and prohibited from future registration at Investing.com’s discretion.