


Sign up to create alerts for Instruments,
Economic Events and content by followed authors
Free Sign Up Already have an account? Sign In
Please try another search

It has been about a month since the last earnings report for Arthur J. Gallagher & Co. (NYSE:AJG) . Shares have added about 5.1% in that time frame, outperforming the market.
Will the recent positive trend continue leading up to its next earnings release, or is AJG due for a pullback? Before we dive into how investors and analysts have reacted as of late, let's take a quick look at the most recent earnings report in order to get a better handle on the important drivers.
Arthur J. Gallagher Beats on Q4 Earnings and Revenues
Arthur J. Gallagher reported fourth-quarter 2017 adjusted net earnings of 82 cents per share, which beat the Zacks Consensus Estimate by about 9.3%. Also, the bottom line improved 24.2% on a year-over-year basis.
The company’s performance was driven by solid organic growth, outstanding revenue improvement from the tuck-in mergers and acquisitions and strong margin expansion. The company also witnessed solid performance across all its segments.
Net income rose 8% year over year to 57 cents per share.
Operational Update
Total revenue was $1.6 billion, up 15.5% year over year. This upside was driven by growth in total revenue in the Brokerage, Risk Management as well as Corporate segments. The top line surpassed the Zacks Consensus Estimate by 7.8%.
Total commissions and fees earned increased nearly 10% year over year to $1.1 billion in the quarter.
Arthur J. Gallagher’s total expense rose 15.2% year over year to $1.5 billion in the quarter. Expenses escalated due to a rise in compensation costs, operating costs, interest expenses, cost of revenues from clean coal activities, plus higher depreciation and amortization expenses.
Earnings before interest, tax, depreciation and amortization and change in estimated acquisition earnout payables (EBITDAC) increased 8.1% to $213.3 million.
Full-Year Highlights
Arthur J. Gallagher’s 2017 adjusted net earnings of $3.06 per share beat the Zacks Consensus Estimate of $2.99. Also, the bottom line improved 12% over 2016.
Revenues came in at $6.2 billion, beating the Zacks Consensus Estimate of $6.1 billion. The top line improved 3% over 2016.
Segment Results
Brokerage: Adjusted revenues of $1 billion grew 12.9% year over year on higher fees, commissions, supplemental revenues and contingent revenues. Total expense shot up nearly 11% year over year to $845.5 million.
Adjusted EBITDAC rose 12.4% to $237 million.
Risk Management: Adjusted revenues were up 6.2% year over year to $197.1 million, owing to higher fees. Total expenses increased 7.9% year over year to $173.8 million.
Adjusted EBITDAC climbed 5.3% year over year to $34 million.
Corporate: Total revenues came in at $401.7 million, up 28% year over year. Total expenses increased 26.5% year over year to $497.6 million.
EBITDAC was at a loss of $57.7 million, wider than a loss of $45.8 million in the prior-year quarter.
Financial Update
As of Dec 31, 2017, total assets were $12.9 billion, up 12.2% from year-end 2016.
Cash and cash equivalents at the year-end increased 21% from the 2016 level to $2.3 billion.
Shareholders’ equity increased about 13.5% from the 2016-end level to $4.2 billion at the end of 2017.
Acquisition Update
In the fourth quarter, the company closed nine acquisitions with annualized revenues of over $29.3 million, taking the full-year tally to 36 acquisitions closed with annualized revenues of over $159 million.
How Have Estimates Been Moving Since Then?
In the past month, investors have witnessed an upward trend in fresh estimates. There have been three revisions higher for the current quarter. While looking back an additional 30 days, we can see even more upward momentum. There have been six moves up in the last two months. In the past month, the consensus estimate has shifted by 14.7% due to these changes.
Arthur J. Gallagher & Co. Price and Consensus
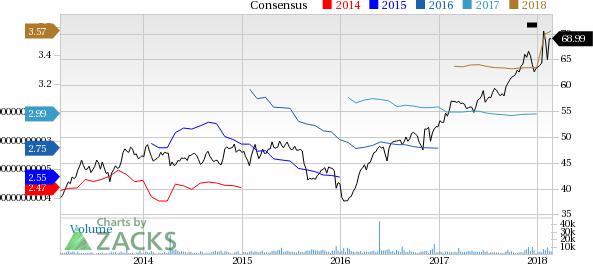
Arthur J. Gallagher & Co. Price and Consensus | Arthur J. Gallagher & Co. Quote
VGM Scores
At this time, AJG has a nice Growth Score of B, though it is lagging a lot on the momentum front with D. The stock was also allocated a grade of D on the value side, putting it in the bottom 40% for this investment strategy.
Overall,the stock has an aggregate VGM Score of C. If you aren't focused on one strategy, this score is the one you should be interested in.
Zacks' style scores indicate that the company's stock is suitable solely for growth investors.
Outlook
Estimates have been trending upward for the stock and the magnitude of these revisions looks promising. It comes with little surprise AJG has a Zacks Rank #2 (Buy). We expect an above average return from the stock in the next few months.
The S&P 500 had started to clear resistance, posting new all-time highs before sellers struck with a vengeance. The selling was bad, similar to that seen in December, which...
Myself and others have highlighted how European Equities have been breaking out to new all-time highs on the back of bullish factors such as cheap valuations, monetary tailwinds,...
Despite the Nasdaq 100’s earlier single-day loss of -3% on 27 January inflicted by Chinese Artificial Intelligence (AI) start-up DeepSeek’s cutting-edge capabilities with lower...
Are you sure you want to block %USER_NAME%?
By doing so, you and %USER_NAME% will not be able to see any of each other's Investing.com's posts.
%USER_NAME% was successfully added to your Block List
Since you’ve just unblocked this person, you must wait 48 hours before renewing the block.
I feel that this comment is:
Thank You!
Your report has been sent to our moderators for review
Add a Comment
We encourage you to use comments to engage with other users, share your perspective and ask questions of authors and each other. However, in order to maintain the high level of discourse we’ve all come to value and expect, please keep the following criteria in mind:
Enrich the conversation, don’t trash it.
Stay focused and on track. Only post material that’s relevant to the topic being discussed.
Be respectful. Even negative opinions can be framed positively and diplomatically. Avoid profanity, slander or personal attacks directed at an author or another user. Racism, sexism and other forms of discrimination will not be tolerated.
Perpetrators of spam or abuse will be deleted from the site and prohibited from future registration at Investing.com’s discretion.