


Sign up to create alerts for Instruments,
Economic Events and content by followed authors
Free Sign Up Already have an account? Sign In
Please try another search

A month has gone by since the last earnings report for Alaska Air Group, Inc. (NYSE:ALK) . Shares have added about 4.7% in the past month, outperforming the market.
Will the recent positive trend continue leading up to its next earnings release, or is ALK due for a pullback? Before we dive into how investors and analysts have reacted as of late, let's take a quick look at its most recent earnings report in order to get a better handle on the important drivers.
Recent Earnings
Alaska Air Group reported fourth-quarter 2017 earnings (excluding $2.14 from non-recurring items) of 83 cents, meeting the Zacks Consensus Estimate. The bottom line plunged 46.79% on a year-over-year basis.
Revenues came in at $1,962 million, marginally above the Zacks Consensus Estimate of $1,961.8 million. The top line also improved 28.7% on a year-over-year basis. Passenger revenues, accounting for a bulk of the top line (86.8%), surged 32.2% on a year-over-year basis.
Operating Statistics
Airline traffic, measured in revenue passenger miles, rose 37.6% year over year to 13,265 million in the reported quarter. Capacity or available seat miles expanded 39.4% to 15,901 million. Load factor (percentage of seat occupancy) contracted 110 basis points to 83.4% on capacity expansion outpacing traffic growth.
Passenger revenue per available seat mile (PRASM: a key measure of unit revenues) decreased 5.1% year over year to 10.71 cents. Total revenue per available seat mile (RASM) also declined 7.6% to 12.34 cents in the quarter under review while yield fell 3.9% to 12.84 cents.
Operating Expenses & Income
In the quarter under discussion, total operating expenses soared 40% year over year to $1,800 million. Operating income reduced 33% to $162 million from the prior-year quarter. Fuel price (economic) was $2 per gallon, up 19%. Consolidated unit cost or cost per available seat mile — excluding fuel and special items — nudged up 2.2% to 8.64 cents.
Liquidity
At the end of the reported quarter, this company had $1,621 million in cash and marketable securities compared with $1,580 million at the end of the comparable period in 2016.
Alaska Air Group exited the quarter with long-term debt of $2,262 million compared with $2,645 million at the end of 2016. At the reported quarter-end, adjusted debt-to-capitalization ratio was 51% compared with 59% at the end of comparable quarter in 2016. Moreover, the carrier has announced a dividend hike of 7% to 32 cents per share from the previous count of 30 cents.
Q1 & 2018 Forecast
For the first quarter of 2018, the carrier expects cost per available seat mile (CASM) excluding fuel and special items to rise approximately 6% year over year. While the same for 2018 is predicted to increase around 2.5%. Economic fuel cost per gallon is anticipated to grow 21% in the first quarter of 2018. While capacity is anticipated to expand around 8% in the first quarter. For the full year, the metric is likely to climb 7.5% whereas effective tax rate in 2018 is estimated to be approximately 24.5%.
How Have Estimates Been Moving Since Then?
In the past month, investors have witnessed a downward trend in fresh estimates. There have been three revisions lower for the current quarter.
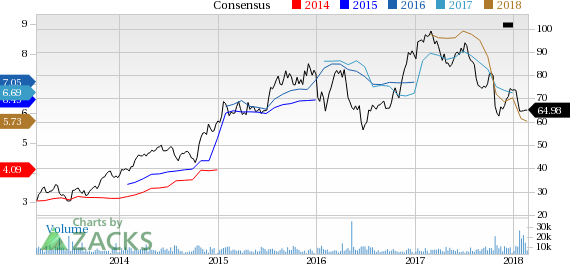
Alaska Air Group, Inc. Price and Consensus | Alaska Air Group, Inc. Quote
VGM Scores
At this time, ALK has an average Growth Score of C, though it is lagging a bit on the momentum front with a D. However, the stock was also allocated a grade of B on the value side, putting it in the top 40% for this investment strategy.
Overall, the stock has an aggregate VGM Score of B. If you aren't focused on one strategy, this score is the one you should be interested in.
Our style scores indicate that the stock is more suitable for value investors than growth investors.
Outlook
Estimates have been broadly trending downward for the stock, and the magnitude of these revisions indicates a downward shift. It's no surprise ALK has a Zacks Rank #4 (Sell). We expect a below average return from the stock in the next few months.
The S&P 500 had started to clear resistance, posting new all-time highs before sellers struck with a vengeance. The selling was bad, similar to that seen in December, which...
Myself and others have highlighted how European Equities have been breaking out to new all-time highs on the back of bullish factors such as cheap valuations, monetary tailwinds,...
Despite the Nasdaq 100’s earlier single-day loss of -3% on 27 January inflicted by Chinese Artificial Intelligence (AI) start-up DeepSeek’s cutting-edge capabilities with lower...
Are you sure you want to block %USER_NAME%?
By doing so, you and %USER_NAME% will not be able to see any of each other's Investing.com's posts.
%USER_NAME% was successfully added to your Block List
Since you’ve just unblocked this person, you must wait 48 hours before renewing the block.
I feel that this comment is:
Thank You!
Your report has been sent to our moderators for review
Add a Comment
We encourage you to use comments to engage with other users, share your perspective and ask questions of authors and each other. However, in order to maintain the high level of discourse we’ve all come to value and expect, please keep the following criteria in mind:
Enrich the conversation, don’t trash it.
Stay focused and on track. Only post material that’s relevant to the topic being discussed.
Be respectful. Even negative opinions can be framed positively and diplomatically. Avoid profanity, slander or personal attacks directed at an author or another user. Racism, sexism and other forms of discrimination will not be tolerated.
Perpetrators of spam or abuse will be deleted from the site and prohibited from future registration at Investing.com’s discretion.