


Sign up to create alerts for Instruments,
Economic Events and content by followed authors
Free Sign Up Already have an account? Sign In
Please try another search

United Technologies Corporation (NYSE:UTX) reported healthy fourth-quarter 2017 results driven by significant organic growth and diligent execution of operational plans. GAAP earnings from continuing operations for the reported quarter were $397 million or 50 cents per share compared with $1,013 million or $1.25 per share in the year-earlier quarter. Excluding restructuring and other non-recurring items, adjusted earnings for the reported quarter were $1.60 per share, which beat the Zacks Consensus Estimate of $1.56. The company reported adjusted earnings of $6.65 for the year ended Dec 31, 2017. GAAP earnings for full-year 2017 were $5.70 per share compared with $6.12 per share of the prior-year quarter.
Net sales in the reported quarter came in at $15,680 million compared with $14,659 million in the year-ago quarter. Quarterly sales exceeded the Zacks Consensus Estimate of $15,400 million. The top-line increase was primarily attributable to organic growth of 5% — the highest since 2014. Growth in revenues across all segments of the company helped drive total revenues. An increase in demand for the company’s products by the commercial aviation industry and an increase in spending by the U.S. defense industry have helped augment revenues for the company. The strong aftermarket business, which sells spare parts and offers related services to keep the primary products running, has also benefited results.
For 2017, the company reported total revenues of $59,837 million compared with $57,244 million in the previous year.
United Technologies Corporation Price, Consensus and EPS Surprise
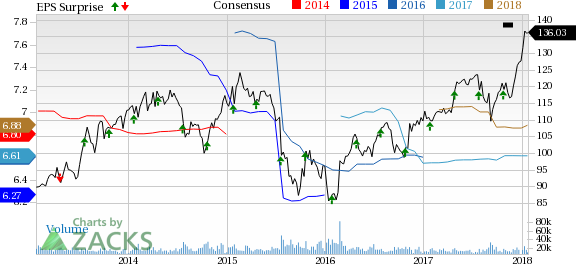
United Technologies Corporation Price, Consensus and EPS Surprise | United Technologies Corporation Quote
Segmental Details
Net sales of Otis were $3,250 million compared with $3,063 million in the prior-year quarter showing an organic growth of 3% for the quarter.
Aggregate quarterly revenues from UTC Climate, Controls & Security came in at $4,520 million compared with $4,249 million in the year-ago quarter, with an organic growth of 3%.
Pratt & Whitney revenues were $4,461 million, up from $3,992 million in the year-ago quarter, with an organic growth of 11%.
UTC Aerospace Systems sales came in at $3,803 million, up from $3,598 million in the year-earlier quarter, showing an organic growth of 5% for the quarter.
Costs and Margins
Operating profit for the reported quarter was $1,952 million compared with $1,639 million in the year-ago period despite rise in operating expenses owing to significant top-line growth.
Operating income for Otis decreased 8.9% year over year to $470 million with margin contraction of 230 basis points making operating margin 14.5%. Operating income of UTC Climate, Controls & Security decreased 6.1% year over year to $636 million with margin contraction of 180 basis points making operating margin 14.1%. Operating profit of Pratt & Whitney increased 6.6% year over year to $436 million with margin contraction of 40 basis points making operating margin 9.8%. Operating profit of UTC Aerospace Systems improved 3.6% year over year to $599 million with margin contraction of 30 basis points making operating margin 15.8%.
Balance Sheet and Cash Flow
United Technologies exited 2017 with cash and cash equivalents of $8,985 million compared with $7,157 million of the previous year while long-term debt stood at $24,989 million compared with $21,697 million of the previous year.
For 2017, the company generated net cash of $5,631 million from its operating activities, down from $6,412 million recorded in the year-ago period.
Outlook
United Technologies is poised to grow on the back of continued investments, strategic cost-reduction efforts and a favorable global macroeconomic environment Backed by these positives, the company has given bullish full-year 2018 earnings guidance. Adjusted earnings are currently anticipated to lie within the $6.85-$7.10 per share range. Additionally, this Zacks Rank #2 (Buy) company has given revenue guidance for 2018 between $62.5-$64 billion (estimating organic growth of 4-6% year over year).
United Technologies’ acquisition of Rockwell Collins (NYSE:COL), an Iowa-based avionics firm has helped create this bullish outlook. The acquisition, slated to be completed by the third quarter of 2018, will provide a huge competitive advantage for the company and increase its bargaining power. The resultant operating synergies and lower operating costs will help it create complementary products that will help it serve evolving global customer needs.
Other Stocks to Consider
Other stocks worth considering in the industry include Raven Industries, Inc. (NASDAQ:RAVN) , Bunzl (LON:BNZL) PLC (OTC:BZLFY) and Leucadia National Corporation (NYSE:LUK) each carrying a Zacks Rank #2. You can see the complete list of today’s Zacks #1 Rank (Strong Buy) stocks here.
Raven has an expected long-term earnings growth rate of 10%. It exceeded estimates thrice in the trailing four quarters with an average beat of 25.8%.
Bunzl PLC has an expected long-term earnings growth rate of 3.2%.
Leucadia National has an expected long-term earnings growth rate of 18%. It exceeded estimates thrice in the trailing four quarters with an average beat of 21.2%.
The Hottest Tech Mega-Trend of All
Last year, it generated $8 billion in global revenues. By 2020, it's predicted to blast through the roof to $47 billion. Famed investor Mark Cuban says it will produce "the world's first trillionaires," but that should still leave plenty of money for regular investors who make the right trades early.
See Zacks' 3 Best Stocks to Play This Trend >>
The S&P 500 had started to clear resistance, posting new all-time highs before sellers struck with a vengeance. The selling was bad, similar to that seen in December, which...
Myself and others have highlighted how European Equities have been breaking out to new all-time highs on the back of bullish factors such as cheap valuations, monetary tailwinds,...
Despite the Nasdaq 100’s earlier single-day loss of -3% on 27 January inflicted by Chinese Artificial Intelligence (AI) start-up DeepSeek’s cutting-edge capabilities with lower...
Are you sure you want to block %USER_NAME%?
By doing so, you and %USER_NAME% will not be able to see any of each other's Investing.com's posts.
%USER_NAME% was successfully added to your Block List
Since you’ve just unblocked this person, you must wait 48 hours before renewing the block.
I feel that this comment is:
Thank You!
Your report has been sent to our moderators for review
Add a Comment
We encourage you to use comments to engage with other users, share your perspective and ask questions of authors and each other. However, in order to maintain the high level of discourse we’ve all come to value and expect, please keep the following criteria in mind:
Enrich the conversation, don’t trash it.
Stay focused and on track. Only post material that’s relevant to the topic being discussed.
Be respectful. Even negative opinions can be framed positively and diplomatically. Avoid profanity, slander or personal attacks directed at an author or another user. Racism, sexism and other forms of discrimination will not be tolerated.
Perpetrators of spam or abuse will be deleted from the site and prohibited from future registration at Investing.com’s discretion.