Here are the Rest of the Top 10:
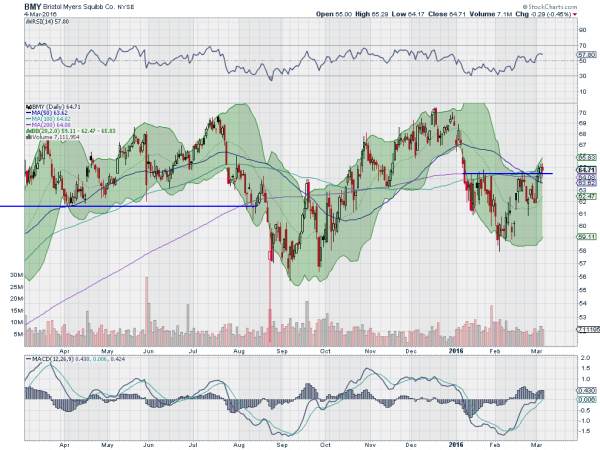
Bristol-Myers Squibb Company (NYSE:BMY)
Bristol-Myers Squibb, $BMY, has been moving in a broad channel between 58 and 70 for 18 months. This after a series of steps higher. Not tight flat steps, but broad messy ones, like the current environment. Most recently is has pressed up to and through an area of resistance for all of 2016. The RSI is trending higher but leveling while the MACD is rising, with the Bollinger Bands® opening higher. These support a continued move up. Look for a move higher Monday to participate.
Cummins (NYSE:CMI)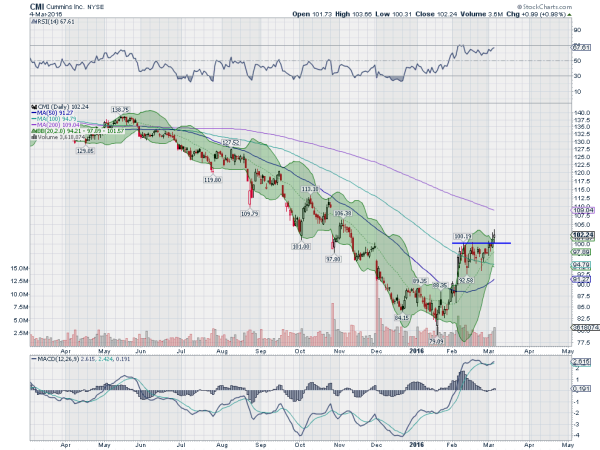
Cummins, $CMI, is revving up for a move higher after a long plunge from May through to January. The bounce from the depths consolidated through February and started higher again at the end of last week. The RSI is in the bullish zone and rising with the MACD turning back higher as well. Look for a continued hold over 100 to participate in the upside.
Rockwell Collins (NYSE:COL)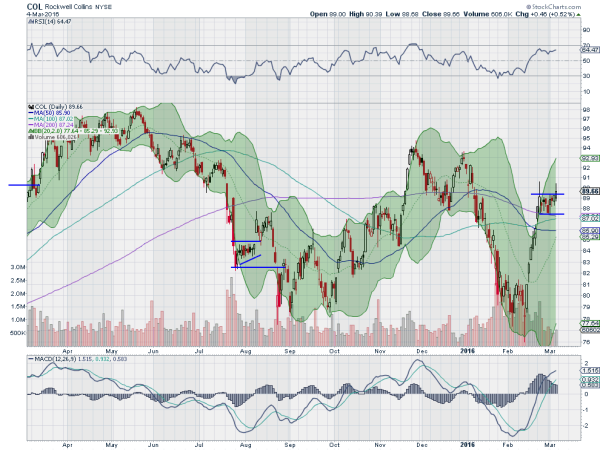
Rockwell Collins, $COL, had a violent drop to start 2016, falling nearly 20% in just 6 weeks. But then it found support and rocketed higher even faster. It spent the last two weeks consolidating that ‘V’ recovery but Friday saw a peek over the top of consolidation. The RSI is in the bullish zone, as the MACD rises, both supporting more upside. Look for confirmation of a break of the consolidation to participate.
eBay Inc (NASDAQ:EBAY)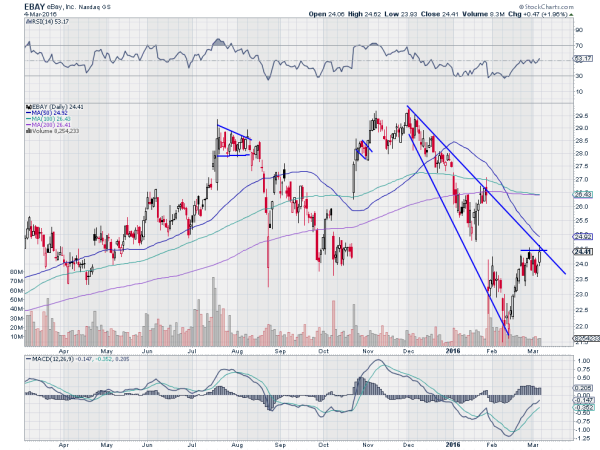
eBay, $EBAY, started to fall in December. It has given two different scenarios where it may have reversed along the way. The first time failed, and it is now trying a second time. The RSI is cruising along the mid line after rising from an oversold condition while the MACD is rising. Look for a move higher to participate in the upside.
State Street Corporation (NYSE:STT)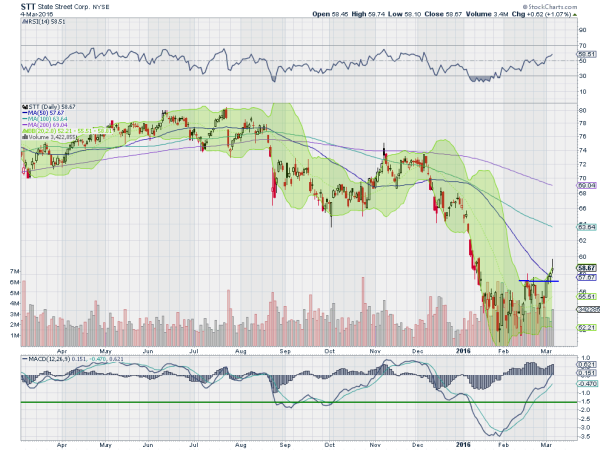
State Street, $STT, fell from a double top over 80 in July to a bottom at the end of January just over 50, losing 38% of its market cap. Since mid January it has gone through a bottoming process and seems to have broken out above that range Friday. But with a Shooting Star candle, a possible reversal. In fact this is an indecision candle so it can play out either direction. With the RSI rising and ion the edge of the bullish zone and the MACD rising, look for a break to the upside to participate.
Up Next: Bonus Idea
After reviewing over 1,000 charts, I have found some good setups for the week. These were selected and should be viewed in the context of the broad Market Macro picture reviewed Friday which heading into the next week sees the equity markets on the verge of a major reversal higher.
Elsewhere look for Gold to continue higher in its uptrend along with Crude Oil. The US Dollar Index looks weak short term in consolidation while US Treasuries are biased lower. The Shanghai Composite and Emerging Markets are biased to the upside in the short run. Volatility looks to continue toward the normal range with a bias lower, adding a breeze to the backs of the equity markets.
The equity index ETF’s SPDR S&P 500 (NYSE:SPY), iShares Russell 2000 (NYSE:IWM) and PowerShares QQQ Trust Series 1 (NASDAQ:QQQ), look better to the upside, with the SPY and IWM showing strength in break a range higher, while the QQQ lags behind but also looks better to the upside. Use this information as you prepare for the coming week and trad’em well.
DISCLAIMER: The information in this blog post represents my own opinions and does not contain a recommendation for any particular security or investment. I or my affiliates may hold positions or other interests in securities mentioned in the Blog, please see my Disclaimer page for my full disclaimer.

