


Sign up to create alerts for Instruments,
Economic Events and content by followed authors
Free Sign Up Already have an account? Sign In
Please try another search

It has been about a month since the last earnings report for The Sherwin-Williams Company (NYSE:SHW) . Shares have lost about 6.2% in that time frame, underperforming the market.
Will the recent negative trend continue leading up to its next earnings release, or is SHW due for a breakout? Before we dive into how investors and analysts have reacted as of late, let's take a quick look at the most recent earnings report in order to get a better handle on the important catalysts.
Sherwin-Williams' Q4 Earnings Trail Estimates, Revenues Beat
Sherwin-Williams logged net income from continuing operations of $897.4 million or $9.39 per share for the fourth quarter of 2017, up more than four-fold from $203 million or $2.15 per share recorded a year ago. The bottom line in the reported quarter was boosted by a one-time benefit of $7.04 per share from deferred income tax reductions.
Earnings, barring one-time items, came in at $2.95 per share, missing the Zacks Consensus Estimate of $3.18.
Sherwin-Williams posted record fourth-quarter revenues of $3,979.6 million, up 43% year over year. It surpassed the Zacks Consensus Estimate of $3,941.2 million. Sales were driven by increased paint sales volumes in the Americas Group unit and the addition of Valspar sales since June 2017.
FY17 Results
For 2017, profit from continued operations was roughly $1.8 billion or $19.11 per share, compared with around $1.1 billion or $11.99 per share recorded an in 2016.
Net sales for 2017 were a record $14,983.8 million, up around 26% year over year. Sales from Valspar since June increased net sales by roughly 21% for the year.
Segment Review
The Americas Group unit registered net sales of $2.19 billion in the reported quarter, up around 9% on a year over year comparison basis. Revenues were driven by increased architectural paint sales volume across all end markets and higher selling prices.
Net sales of the Consumer Brands Group unit surged around 89% to $571.6 million, driven by the addition of Valspar sales since June, partly masked by reduced volume sales to some of the unit’s retail customers. Valspar sales increased the division’s net sales by around 96% in the quarter.
Net sales from the Performance Coatings Group zoomed around 160% to $1.22 billion in the quarter owing to inclusion of Valspar sales and higher selling prices. Valspar sales contributed roughly 152% to the segment’s net sales in the quarter.
Financials and Shareholder Returns
Sherwin-Williams made no open market purchases of its common stock during the twelve months ended Dec 31, 2017. At the end of 2017, it had $204.2 million cash in hand, which it plans to use to fund operations and reduce debt.
Outlook
Sherwin-Williams projects mid-to-high single digit percentage increase in net sales year over year for first-quarter 2018. It also sees incremental sales from Valspar acquisition to be roughly $1 billion in the first quarter.
For full-year 2018, Sherwin-Williams projects mid-to-high single digit percentage increase in net sales from 2017. It also sees incremental sales from the Valspar buyout to be roughly $1.6 billion for the first five months of the year. At this level, the company expects earnings per share for the year to be in the range of $15.35 to $15.85 per share, compared with $18.67 earned in 2017. The guidance includes around $3.45 per share charge related to the Valspar acquisition.
How Have Estimates Been Moving Since Then?
It turns out, fresh estimates have trended downward during the past month. There has been one revision higher for the current quarter compared to two lower.
The Sherwin-Williams Company Price and Consensus
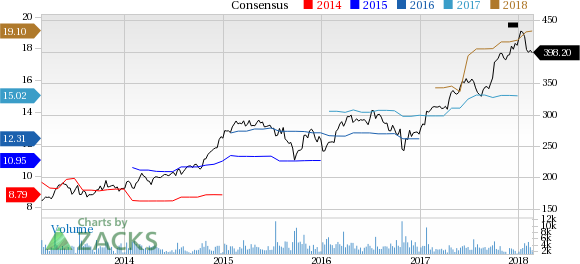
The Sherwin-Williams Company Price and Consensus | The Sherwin-Williams Company Quote
VGM Scores
At this time, SHW has a nice Growth Score of B, though it is lagging a bit on the momentum front with a C. Following the exact same course, the stock was also allocated a grade of C on the value side, putting it in the middle 20% for this investment strategy.
Overall, the stock has an aggregate VGM Score of C. If you aren't focused on one strategy, this score is the one you should be interested in.
Based on our scores, the stock is more suitable for growth investors than those looking for value and momentum.
Outlook
Estimates have been broadly trending downward for the stock and the magnitude of these revisions indicates a downward shift. Interestingly, SHW has a Zacks Rank #3 (Hold). We expect an in-line return from the stock in the next few months.
The S&P 500 had started to clear resistance, posting new all-time highs before sellers struck with a vengeance. The selling was bad, similar to that seen in December, which...
Myself and others have highlighted how European Equities have been breaking out to new all-time highs on the back of bullish factors such as cheap valuations, monetary tailwinds,...
Despite the Nasdaq 100’s earlier single-day loss of -3% on 27 January inflicted by Chinese Artificial Intelligence (AI) start-up DeepSeek’s cutting-edge capabilities with lower...
Are you sure you want to block %USER_NAME%?
By doing so, you and %USER_NAME% will not be able to see any of each other's Investing.com's posts.
%USER_NAME% was successfully added to your Block List
Since you’ve just unblocked this person, you must wait 48 hours before renewing the block.
I feel that this comment is:
Thank You!
Your report has been sent to our moderators for review
Add a Comment
We encourage you to use comments to engage with other users, share your perspective and ask questions of authors and each other. However, in order to maintain the high level of discourse we’ve all come to value and expect, please keep the following criteria in mind:
Enrich the conversation, don’t trash it.
Stay focused and on track. Only post material that’s relevant to the topic being discussed.
Be respectful. Even negative opinions can be framed positively and diplomatically. Avoid profanity, slander or personal attacks directed at an author or another user. Racism, sexism and other forms of discrimination will not be tolerated.
Perpetrators of spam or abuse will be deleted from the site and prohibited from future registration at Investing.com’s discretion.