


Sign up to create alerts for Instruments,
Economic Events and content by followed authors
Free Sign Up Already have an account? Sign In
Please try another search

A month has gone by since the last earnings report for Hilltop Holdings Inc. (NYSE:HTH) . Shares have lost about 6.1% in that time frame, underperforming the market.
Will the recent negative trend continue leading up to its next earnings release, or is HTH due for a breakout? Before we dive into how investors and analysts have reacted as of late, let's take a quick look at its most recent earnings report in order to get a better handle on the important drivers.
Hilltop Holdings’ Q4 Earnings Beat Estimates, Costs Down
Hilltop Holdings reported fourth-quarter 2017 adjusted earnings per share of 44 cents, which surpassed the Zacks Consensus Estimate of 42 cents.
Results benefited from lower expenses and higher net interest income. Also, improvement in loan and deposit balances supported the results to quite an extent. However, a decline in non-interest income and higher provisions were the undermining factors.
After taking into consideration certain non-recurring items (including the Tax Act related adjustment), net income applicable to common stockholders for the quarter came in at $13.4 million or 14 cents per share, compared with $35.3 million or 36 cents per share in the prior-year quarter.
For 2017, the company reported GAAP net income applicable to common stockholders of $132.5 million or $1.36 per share, down from $145.9 million or $1.48 per share registered in 2016.
Revenues & Costs Decrease
Operating revenues for the quarter were $399.1 million, decreasing 3.4% year over year. However, the figure surpassed the Zacks Consensus Estimate of $390 million.
For 2017, total revenues came in at $1.63 billion, decreasing 3.4% from 2016.
Net interest income for the quarter grew 4.4% year over year to $108.7 million. Net interest margin was 3.63%, down 17 basis points (bps) from the prior-year quarter.
Non-interest income dropped 6% from the year-ago quarter to $290.5 million. The decline was due to a fall in all components except securities commissions and fees, and investment and securities advisory fees and commissions.
Non-interest expenses decreased 7.6% year over year to $328.7 million. This was attributable to a decline in all cost components, except net occupancy and equipment costs.
Credit Quality Worsens
Provision for loan losses was $5.5 million in the quarter, increasing 25.4% year over year. Also, non-covered non-performing assets as a percentage of total assets were 0.33% at the end of the quarter, up 9 bps from the prior-year quarter. Further, non-covered, non-performing loans were $40.5 million as of Dec 31, 2017, up from $24.4 million as of Dec 31, 2016.
Strong Balance Sheet
As of Dec 31, 2017, Hilltop Holdings’ cash and due from banks was $487 million, increasing 37.3% sequentially. Further, total shareholders’ equity was $1.9 billion, marginally up sequentially.
Net non-covered loans were $6.2 billion as of Dec 31, 2017, up 2% sequentially. Also, total deposits grew 4.1% from the prior-quarter to nearly $8 billion.
Profitability & Capital Ratios Deteriorate
Return on average assets at the end of the quarter was 0.41%, down from 1.13% in the prior-year quarter. Additionally, return on average equity was 2.78%, decreasing from 7.56% in the year-ago quarter.
Common equity tier-1 capital ratio was 17.69% as of Dec 31, 2017, down from 18.30% as of Dec 31, 2016. Also, the total capital ratio was 18.77%, declining from 19.34% in the prior-year quarter.
Outlook
The company expects net revenues in the Broker-Dealer segment to be approximately $400 million in 2018.
The company expects core margin to be in the range of 3.12-3.18% in 2018, assuming no further rate hikes this year.
Further, the company expects purchase loan accretion in 2018 to be approximately $6-$8 million per quarter.
The company expects GAAP effective tax rate to be nearly 23-25%.
How Have Estimates Been Moving Since Then?
It turns out, fresh estimates flatlined during the past month. There has been one revision higher for the current quarter compared to one lower.
Hilltop Holdings Inc. Price and Consensus
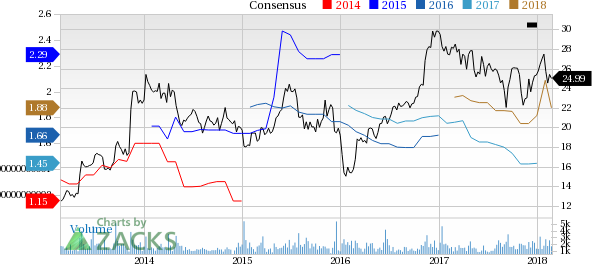
Hilltop Holdings Inc. Price and Consensus | Hilltop Holdings Inc. Quote
VGM Scores
At this time, HTH has a subpar Growth Score of D, though it is doing a lot better on the momentum front with an B. The stock was allocated a grade of A on the value side, putting it in the top quintile for this investment strategy.
Overall, the stock has an aggregate VGM Score of B. If you aren't focused on one strategy, this score is the one you should be interested in.
The company's stock is more suitable for value than momentum based on our styles scores.
Outlook
HTH has a Zacks Rank #3 (Hold). We expect an in-line return from the stock in the next few months.
The S&P 500 had started to clear resistance, posting new all-time highs before sellers struck with a vengeance. The selling was bad, similar to that seen in December, which...
Myself and others have highlighted how European Equities have been breaking out to new all-time highs on the back of bullish factors such as cheap valuations, monetary tailwinds,...
Despite the Nasdaq 100’s earlier single-day loss of -3% on 27 January inflicted by Chinese Artificial Intelligence (AI) start-up DeepSeek’s cutting-edge capabilities with lower...
Are you sure you want to block %USER_NAME%?
By doing so, you and %USER_NAME% will not be able to see any of each other's Investing.com's posts.
%USER_NAME% was successfully added to your Block List
Since you’ve just unblocked this person, you must wait 48 hours before renewing the block.
I feel that this comment is:
Thank You!
Your report has been sent to our moderators for review
Add a Comment
We encourage you to use comments to engage with other users, share your perspective and ask questions of authors and each other. However, in order to maintain the high level of discourse we’ve all come to value and expect, please keep the following criteria in mind:
Enrich the conversation, don’t trash it.
Stay focused and on track. Only post material that’s relevant to the topic being discussed.
Be respectful. Even negative opinions can be framed positively and diplomatically. Avoid profanity, slander or personal attacks directed at an author or another user. Racism, sexism and other forms of discrimination will not be tolerated.
Perpetrators of spam or abuse will be deleted from the site and prohibited from future registration at Investing.com’s discretion.