Breaking News
Get 45% Off 0
Is it finally time to sell Nvidia ahead of earnings?
Read More

Grainger (GWW) Q4 Earnings, Revenues Beat On Higher Volumes

By Zacks Investment ResearchStock MarketsJan 23, 2018 10:53PM ET
www.investing.com/analysis/grainger-gww-q4-earnings-revenues-beat-on-higher-volumes-200283214
Grainger (GWW) Q4 Earnings, Revenues Beat On Higher Volumes
By Zacks Investment Research   |  Jan 23, 2018 10:53PM ET
Saved. See Saved Items.
This article has already been saved in your Saved Items
 
 
CAT
-0.33%
Add to/Remove from Watchlist
Add to Watchlist
Add Position

Position added successfully to:

Please name your holdings portfolio
 
DE
-1.11%
Add to/Remove from Watchlist
Add to Watchlist
Add Position

Position added successfully to:

Please name your holdings portfolio
 
GWW
-0.98%
Add to/Remove from Watchlist
Add to Watchlist
Add Position

Position added successfully to:

Please name your holdings portfolio
 
HEES
-1.43%
Add to/Remove from Watchlist
Add to Watchlist
Add Position

Position added successfully to:

Please name your holdings portfolio
 
W.W. Grainger, Inc.’s (NYSE:GWW) fourth-quarter 2017 adjusted earnings per share of $2.94 came in higher than the prior-year figure of $2.45 by 20%. Further, earnings beat the Zacks Consensus Estimate of $2.18 by wide margin of 35%. The company witnessed strong volumes in its U.S. business driven by strategic pricing initiatives as well as an improving demand environment. Grainger’s shares gained 12.71% in pre-market trading.
Including one-time items such as restructuring charges and other charges, earnings came in at $2.63 per share in the reported quarter, up 160% from $1.01 in the year-ago quarter.
Operational Update
Grainger reported revenues of $2,632 million, up 6.5% from the prior-year quarter figure of $2,471 million, driven by an increase of 11 percentage point (pp) from volume growth. This was partly offset by a decline of 3 pp in price and 1 pp from the divestiture of a specialty business in the United States in mid-July. The figure also beat the Zacks Consensus Estimate of $2,568 million. There were 63 selling days in the reported quarter, same as in fourth-quarter 2016.
Cost of sales increased 8.8% year over year to $1,611 million. Gross profit increased 3% to $1,021 million from $990 million recorded in the year-ago quarter. Gross margin contracted 130 basis points (bps) to 38.8%.
Grainger’s adjusted operating income in the quarter increased 4% to $285 million from $275 million recorded in the prior-year quarter. Adjusted operating margin fell 30 bps to 10.8% in the quarter from 11.1% in the year-earlier quarter.

W.W. Grainger, Inc. Price, Consensus and EPS Surprise

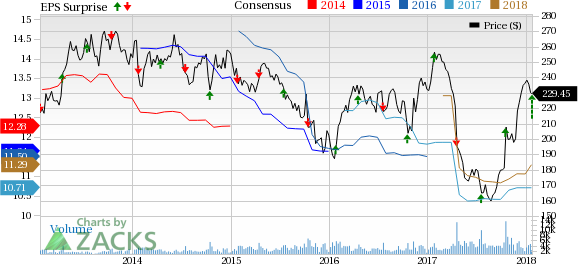
W.W. Grainger, Inc. Price, Consensus and EPS Surprise | W.W. Grainger, Inc. Quote

Segment Performance

Revenues for the U.S. segment rose 5% year over year to $1,991 million, resulting from 11 pp increase from volume partially offset by declines of 5 pp from price and 1 pp from the divestiture of a specialty business. Adjusted operating income for the segment decreased 1% year over year to $299 million.

Revenues of $189 million from the Canada segment increased 4.5% in U.S. dollars. The increase consisted of 5 pp from favorable foreign exchange and 4 pp increase from price, partially negated by 4 pp decrease from volume. The segment reported an adjusted operating loss of $4.3 million compared with a loss of $10.7 million incurred in the prior-year quarter.

Revenues from Other businesses (which include Asia, Europe and Latin America) climbed 16% year over year to $559 million primarily driven by MonotaRO in Japan and Zoro in the United States. The segment’s adjusted operating profit improved 51% to $25 million from $17 million recorded in the comparable period last year.

Financial Position

Grainger had cash and cash equivalents of $327 million at the end of 2017 compared with $274 million at the end of 2016. Cash provided by operating activities increased to $1.1 billion in fiscal 2017, compared with $1.0 billion in the prior year.

As of 2017-end, the company’s long-term debt increased to $2.25 billion compared with $1.84 billion at the end of 2016. During 2017, the company returned $910 million in cash to shareholders through $304 million in dividends and $605 million to buy back 3 million shares.

Fiscal 2017 Performance

Grainger’s adjusted earnings per share edged down 1% year over year to $11.46 in fiscal 2017. Earnings outpaced the Zacks Consensus Estimate of $10.71. Revenues came in at $10.4 billion that beat the Zacks Consensus Estimate of $10.36 and also improved 3% on a year-over-year basis.

Guidance

To reflect lower corporate taxes due to U.S. tax legislation and better-than-expected 2017 results, Grainger raised earnings per share guidance for 2018. The company maintains sales growth guidance in the range of 3-7%.

Earnings per share for 2018 is now projected at $12.95-$14.15, up from the previous range of $10.60-$11.80. The increase in the guidance factors in a 50 cents contribution from better-than-expected 2017 operating performance, a $2.15 benefit from a lower corporate tax rate under U.S. tax legislation and 6 cents from incremental share buybacks funded by the benefits of the tax legislation. However, these gains will be partially offset by 10 cents of lower benefits from clean energy investments and 26 cents in increased investment in the business funded by the gains of the tax legislation.

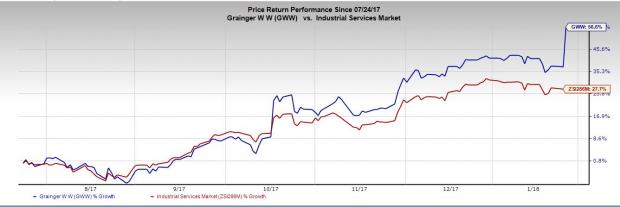
Share Price Performance

In the past six months, Grainger outperformed the industry with respect to price performance. The stock gained 56.6%, compared with industry’s growth of 27.7%.
Zacks Rank
Grainger currently carries a Zacks Rank #3 (Hold).
Some better-ranked stocks in the sector are Deere & Company (NYSE:DE) , H&E Equipment Services, Inc. (NASDAQ:HEES) and Caterpillar Inc. (NYSE:CAT) . While Deere and H&E Equipment sport a Zacks Rank #1 (Strong Buy), Caterpillar carries a Zacks Rank #2 (Buy). You can see the complete list of today’s Zacks #1 Rank stocks here.
Deere has a long-term earnings growth rate of 8.2%. Its shares have rallied 32% in the past year.
H&E Equipment Services has a long-term earnings growth rate of 18.6%. The company’s shares have appreciated 82.8% in a year.
Caterpillar has a long-term earnings growth rate of 10.3%. The stock has gained 48% in a year’s time.
The Hottest Tech Mega-Trend of All
Last year, it generated $8 billion in global revenues. By 2020, it's predicted to blast through the roof to $47 billion. Famed investor Mark Cuban says it will produce "the world's first trillionaires," but that should still leave plenty of money for regular investors who make the right trades early.


Caterpillar, Inc. (CAT): Free Stock Analysis Report

H&E Equipment Services, Inc. (HEES): Free Stock Analysis Report

Deere & Company (DE): Free Stock Analysis Report

W.W. Grainger, Inc. (GWW): Free Stock Analysis Report

Original post

Zacks Investment Research
Grainger (GWW) Q4 Earnings, Revenues Beat On Higher Volumes
 

Related Articles

Grainger (GWW) Q4 Earnings, Revenues Beat On Higher Volumes

Add a Comment

Comment Guidelines

We encourage you to use comments to engage with other users, share your perspective and ask questions of authors and each other. However, in order to maintain the high level of discourse we’ve all come to value and expect, please keep the following criteria in mind:  

  •            Enrich the conversation, don’t trash it.

  •           Stay focused and on track. Only post material that’s relevant to the topic being discussed. 

  •           Be respectful. Even negative opinions can be framed positively and diplomatically. Avoid profanity, slander or personal attacks directed at an author or another user. Racism, sexism and other forms of discrimination will not be tolerated.

  • Use standard writing style. Include punctuation and upper and lower cases. Comments that are written in all caps and contain excessive use of symbols will be removed.
  • NOTE: Spam and/or promotional messages and comments containing links will be removed. Phone numbers, email addresses, links to personal or business websites, Skype/Telegram/WhatsApp etc. addresses (including links to groups) will also be removed; self-promotional material or business-related solicitations or PR (ie, contact me for signals/advice etc.), and/or any other comment that contains personal contact specifcs or advertising will be removed as well. In addition, any of the above-mentioned violations may result in suspension of your account.
  • Doxxing. We do not allow any sharing of private or personal contact or other information about any individual or organization. This will result in immediate suspension of the commentor and his or her account.
  • Don’t monopolize the conversation. We appreciate passion and conviction, but we also strongly believe in giving everyone a chance to air their point of view. Therefore, in addition to civil interaction, we expect commenters to offer their opinions succinctly and thoughtfully, but not so repeatedly that others are annoyed or offended. If we receive complaints about individuals who take over a thread or forum, we reserve the right to ban them from the site, without recourse.
  • Only English comments will be allowed.
  • Any comment you publish, together with your investing.com profile, will be public on investing.com and may be indexed and available through third party search engines, such as Google.

Perpetrators of spam or abuse will be deleted from the site and prohibited from future registration at Investing.com’s discretion.

Write your thoughts here
 
Are you sure you want to delete this chart?
 
Post
Post also to:
 
Replace the attached chart with a new chart ?
1000
Your ability to comment is currently suspended due to negative user reports. Your status will be reviewed by our moderators.
Please wait a minute before you try to comment again.
Thanks for your comment. Please note that all comments are pending until approved by our moderators. It may therefore take some time before it appears on our website.
 
Are you sure you want to delete this chart?
 
Post
 
Replace the attached chart with a new chart ?
1000
Your ability to comment is currently suspended due to negative user reports. Your status will be reviewed by our moderators.
Please wait a minute before you try to comment again.
Add Chart to Comment
Confirm Block

Are you sure you want to block %USER_NAME%?

By doing so, you and %USER_NAME% will not be able to see any of each other's Investing.com's posts.

%USER_NAME% was successfully added to your Block List

Since you’ve just unblocked this person, you must wait 48 hours before renewing the block.

Report this comment

I feel that this comment is:

Comment flagged

Thank You!

Your report has been sent to our moderators for review
Continue with Apple
Continue with Google
or
Sign up with Email