


Sign up to create alerts for Instruments,
Economic Events and content by followed authors
Free Sign Up Already have an account? Sign In
Please try another search

Amphenol Corporation (NYSE:APH) reported strong fourth-quarter 2017 results with healthy year-over-year increases in both earnings and revenues.
Earnings and Revenues
Quarterly adjusted earnings came in at 86 cents per share, surpassing the Zacks Consensus Estimate of 81 cents per share. Notably, the bottom line also came in higher than the year-ago tally of 75 cents per share.
Quarterly revenues came in at $1,943.9 million, beating the Zacks Consensus Estimate of $1,791 million. Further, the top line came in higher than the prior-year figure of $1,651.1 million.
For full year 2017, Amphenol recorded GAAP earnings of $650.5 million or $2.06 per share compared with 822.9 million or $2.61 per share in 2016. Excluding non-recurring items, adjusted earnings for 2017 were $3.12 per share compared with $2.72 in 2016.
Segmental Performance
Revenues of Interconnect Products and Assemblies segment came in at $1,852.6 million, up 19.1% year over year.
However, sales of Cable Products and Solutions segment were $91.3 million, down 4.7% year over year.
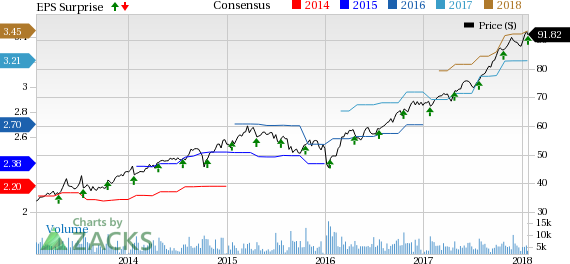
Amphenol Corporation Price, Consensus and EPS Surprise | Amphenol Corporation Quote
Costs and Margins
Cost of sales in the reported quarter came in at $1,308.5 million, up 18.4% year over year. Gross profit margin the quarter came in at 32.7%, contracting 40 basis points year over year.
Selling, general and administrative expenses flared up 14% year over year to $236 million. Operating margin in the quarter remained constant at 20.5%, in comparison with the year-over-year figure. Interest expense during the quarter was $25 million compared with $18.4 million reported in the year-earlier quarter.
Balance Sheet and Cash Flow
Exiting the quarter, Amphenol had cash and cash equivalents worth $1,719.1million, higher than $1,034.6 million recorded at the end of 2016. Long-term debt came in at $3,541.5 million, higher than $2,635.5 million recorded on Dec 31, 2016.
Cash flow from operations for 2017 reached record level of $1,144.2 million compared with $1,077.6 million in the prior-year period. Capital expenditure came in at $226.6 million, compared with $190.8 million recorded in the comparable period last year.
During the quarter, Amphenol repurchased approximately 0.7 million shares pursuant to its $1 billion two-year open market stock repurchase plan.
Outlook
The company anticipates generating first-quarter 2018 revenues within the range of $1.780-$1.820 billion. While adjusted earnings for first-quarter 2018 is predicted to lie within 78-80 cents per share.
For full-year 2018, this Zacks Rank #3 (Hold) company expects sales in the range of $7.440-$7.600 billion, representing a year-over-year increase of 6-8%. The company expects adjusted earnings per share in the range of $3.39-$3.47, an increase of 9-11% year over year.
Stocks to Consider
Some better-ranked stocks worth considering in the same space include Cray Inc (NASDAQ:CRAY) , Analog Devices, Inc. (NASDAQ:ADI) and Applied Materials, Inc. (NASDAQ:AMAT) . While Cray sports a Zacks Rank #1 (Strong Buy), Analog Devices and Applied Materials carry a Zacks Rank #2 (Buy). You can see the complete list of today’s Zacks #1 Rank stocks here.
Cray has a decent earnings surprise history, surpassing estimates thrice in the trailing four quarters with an average beat of 12.3%.
Analog Devices has an excellent earnings surprise history, exceeding estimates in the trailing four quarters with an average beat of 16.3%.
Applied Materials has posted earning beat in the trailing four quarters. It boasts an average beat of 2.8%.
The Hottest Tech Mega-Trend of All
Last year, it generated $8 billion in global revenues. By 2020, it's predicted to blast through the roof to $47 billion. Famed investor Mark Cuban says it will produce "the world's first trillionaires," but that should still leave plenty of money for regular investors who make the right trades early.
See Zacks' 3 Best Stocks to Play This Trend >>
The S&P 500 had started to clear resistance, posting new all-time highs before sellers struck with a vengeance. The selling was bad, similar to that seen in December, which...
Myself and others have highlighted how European Equities have been breaking out to new all-time highs on the back of bullish factors such as cheap valuations, monetary tailwinds,...
Despite the Nasdaq 100’s earlier single-day loss of -3% on 27 January inflicted by Chinese Artificial Intelligence (AI) start-up DeepSeek’s cutting-edge capabilities with lower...
Are you sure you want to block %USER_NAME%?
By doing so, you and %USER_NAME% will not be able to see any of each other's Investing.com's posts.
%USER_NAME% was successfully added to your Block List
Since you’ve just unblocked this person, you must wait 48 hours before renewing the block.
I feel that this comment is:
Thank You!
Your report has been sent to our moderators for review
Add a Comment
We encourage you to use comments to engage with other users, share your perspective and ask questions of authors and each other. However, in order to maintain the high level of discourse we’ve all come to value and expect, please keep the following criteria in mind:
Enrich the conversation, don’t trash it.
Stay focused and on track. Only post material that’s relevant to the topic being discussed.
Be respectful. Even negative opinions can be framed positively and diplomatically. Avoid profanity, slander or personal attacks directed at an author or another user. Racism, sexism and other forms of discrimination will not be tolerated.
Perpetrators of spam or abuse will be deleted from the site and prohibited from future registration at Investing.com’s discretion.