


Sign up to create alerts for Instruments,
Economic Events and content by followed authors
Free Sign Up Already have an account? Sign In
Please try another search

It has been about a month since the last earnings report for Western Digital Corporation (NASDAQ:WDC) . Shares have added about 1.3% in the past month, outperforming the market.
Will the recent positive trend continue leading up to its next earnings release, or is WDC due for a pullback? Before we dive into how investors and analysts have reacted as late, let's take a quick look at the most recent earnings report in order to get a better handle on the important catalysts.
Recent Earnings
Western Digital reported second-quarter fiscal 2018 non-GAAP earnings of $3.95 per share, which beat the Zacks Consensus Estimate by 14 cents and soared 71.7% from the year-ago quarter.
After adjusting for a provisional net tax charge of $1.6 billion, primarily due to the repatriation tax as a result of the Tax Cuts and Jobs Act, GAAP loss was $2.78 per share.
Revenues increased 9.2% year over year to $5.34 billion and surpassed the Zacks Consensus Estimate of $5.29 billion. The strong top-line growth reflected healthy demand in the company’s end-markets for high capacity enterprise hard drives and flash-based products.
Western Digital has started deploying 64-layer 3D technology across its product portfolio and the ramp of the 96-layer technology is expected in the later part of 2018. The company MAMR-based capacity enterprise hard drives are expected to be available for sampling in the second half of 2018.
Exabyte Growth Rate to Improve
Western Digital started shipping its 14TB drives for hyperscale applications during the quarter. The company shipped 42.3 million HDDs at an average selling price (ASP) of $63. The reported shipments were down from 44.8 million shipped in the year-ago quarter.
During the quarter, the company shipped 95.3 Exabytes, excluding non-memory products.
Western Digital estimates that the year-over-year industry Exabyte growth rate will exceed 60% in the first-half of calendar 2018. For full-year, the company anticipates 50% growth, a lot better than 30% in calendar 2017.
Management stated that datacenter buildout by several hyperscale customers along with ongoing data explosion and increasing value of data are driving demand for high capacity enterprise drives in the high-end as well as in the mid-range.
Western Digital has lower market share in the mid-range (4TB to 8TB). The company has launched products to address the growing needs of mid-range market particularly in Asia.
Western Digital expects the demand for high and mid-range capacity drives to support the higher rate of Exabyte consumption in calendar 2018. The company’s long-term annual Exabyte growth estimate remains unchanged at 40%.
From the Flash industry perspective, Western Digital estimates industry bit growth to be near the high-end of the long-term range (between 35% and 45%) in calendar 2018, primarily due to improving manufacturing yields and continued transition to 3D flash. The company expects to deliver growth consistent with the industry rate.
Joint Venture on Track
In December, 2017, Western Digital settled its dispute with long-time joint venture (JV) partner, Toshiba, over the divestiture of Toshiba Memory Corporation (TMC) to a consortium led by Bain Capital. The company gave consent to the transfer of Toshiba’s equity interests in the JVs to TMC.
The settlement now ensures long-term availability of NAND supply for Western Digital.
Western Digital also announced that it will participate in the development of Fab 6 starting with the second investment tranche. Fab 6 operations are expected to commence in the next few months with initial bit output in the third calendar quarter of 2018.
The company also expects to participate in the new wafer fab scheduled to be constructed in Iwate.
Segment Revenue Details
Client devices (49.6% of total revenues) increased 9.5% year over year to $2.65 billion. The growth was primarily due to strong demand for embedded flash and client SSD products. Connected home, surveillance, and industrial were strong growth verticals for the company’s products.
Western Digital has started shipping 3D flash-based embedded solutions for the mobile and compute markets, which include its first UFS offering. The product expands Western Digital’s market opportunities significantly.
Client solutions (23.5% of total revenues) surged 16.6% to $1.26 billion, driven by solid adoption of G-Tech, SanDisk and WD brands, especially during the holiday season.
Data center devices and solutions (26.9% of total revenues) increased 2.9% to $1.43 billion on the back of strong demand for high capacity storage devices. Solid adoption of 10 Terabyte (TB) third generation Helium drive and accelerated transition to 12 TB was observed in the quarter.
Operating Details, Cost Improvement to Continue
Non GAAP gross margin expanded 660 basis points (bps) on a year-over-year basis to 43.2%. The growth was driven by favorable supply/demand environment for flash-based products, cost improvements, and a higher mix of flash-based revenues.
Non GAAP operating expenses, as a percentage of revenues, decreased 10 bps to 16.2%. Research and development (R&D) expenses as a percentage of revenues declined 20 bps to 11.8%. Selling, general & administrative (SG&A) expense also decreased 20 bps to 7.1%.
Non GAAP operating margin also expanded 660 bps to 27%.
Western Digital expects cost and expenses to decline further, primarily due to lower development expenses in product portfolio. The company has stopped investing in performance enterprise drives and is narrowing its client HDD portfolio. The company has also announced closure of manufacturing operations in China and Singapore.
Balance Sheet & Cash Flow
As of Dec 29, 2017, cash and cash equivalents were $6.27 billion, down from $5.65 billion as of Sep 29, 2017.
Long-term debt was $12.05 billion, down from $13.13 billion at the end of the first quarter. The company repaid its EURO Term Loan B during the quarter.
During the quarter, Western Digital generated $1.18 billion in cash from operations compared with $1.13 billion in the first-quarter fiscal 2018. Free cash flow was $553 million in the reported quarter, down from $847 million in first-quarter fiscal 2018.
Tax Reform Benefits Western Digital
The recently enacted tax reform benefits Western Digital, as the company can now access its “global cash in the U.S. in a highly efficient manner.” The company booked a provisional net tax charge of $1.6 billion in the second-quarter, primarily due to the one-time mandatory deemed repatriation tax.
The payment of this repatriation tax will be spread over the next eight years, which is expected to begin in fiscal 2019, with approximately 60% due in the last three years of the period.
Beginning fiscal 2019, Western Digital expects non-GAAP effective tax rate to be at the high end or slightly above its long-term guidance of 7% to 12%.
Guidance
For third-quarter fiscal 2018, revenues are expected to be approximately $4.9 billion.
Gross margin is anticipated between 42% and 43%.
Operating expenses are expected between $840 million and $850 million, which include the annual payroll tax reset. Interest and other expenses are estimated between $180 million and $185 million.
Management expects non-GAAP earnings between $3.20 and $3.30 per share.
For fiscal 2018, Western Digital expects revenues to grow at the high end of its long-term target of 4-8% range. The company forecasts non-GAAP earnings between $13.50 and $14.00 per share, better than the previous guidance of $13.00 per share.
How Have Estimates Been Moving Since Then?
Analysts were quiet during the last month as none of them issued any earnings estimate revisions.
Western Digital Corporation Price and Consensus
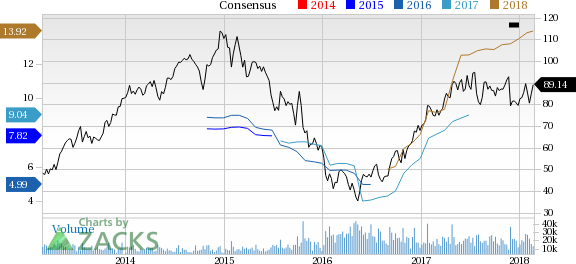
Western Digital Corporation Price and Consensus | Western Digital Corporation Quote
VGM Scores
At this time, WDC has a great Growth Score of A, though it is lagging a bit on the momentum front with a B. However, the stock was allocated a grade of A on the value side, putting it in the top quintile for this investment strategy.
Overall, the stock has an aggregate VGM Score of A. If you aren't focused on one strategy, this score is the one you should be interested in.
Zacks' style scores indicate that the company's stock is equally suitable for value and growth investors.
Outlook
WDC has a Zacks Rank #3 (Hold). We expect in-line returns from the stock in the next few months.
Palantir remains highly valued with a 460x P/E ratio and a 42.5x P/B ratio, far above its peers. The stock's beta of 2.81 signals high volatility, meaning sharp moves in both...
The S&P 500 had started to clear resistance, posting new all-time highs before sellers struck with a vengeance. The selling was bad, similar to that seen in December, which...
Myself and others have highlighted how European Equities have been breaking out to new all-time highs on the back of bullish factors such as cheap valuations, monetary tailwinds,...
Are you sure you want to block %USER_NAME%?
By doing so, you and %USER_NAME% will not be able to see any of each other's Investing.com's posts.
%USER_NAME% was successfully added to your Block List
Since you’ve just unblocked this person, you must wait 48 hours before renewing the block.
I feel that this comment is:
Thank You!
Your report has been sent to our moderators for review
Add a Comment
We encourage you to use comments to engage with other users, share your perspective and ask questions of authors and each other. However, in order to maintain the high level of discourse we’ve all come to value and expect, please keep the following criteria in mind:
Enrich the conversation, don’t trash it.
Stay focused and on track. Only post material that’s relevant to the topic being discussed.
Be respectful. Even negative opinions can be framed positively and diplomatically. Avoid profanity, slander or personal attacks directed at an author or another user. Racism, sexism and other forms of discrimination will not be tolerated.
Perpetrators of spam or abuse will be deleted from the site and prohibited from future registration at Investing.com’s discretion.