


Sign up to create alerts for Instruments,
Economic Events and content by followed authors
Free Sign Up Already have an account? Sign In
Please try another search

Malaysia’s consumer price index increased 3.4% year over year in November compared with 3.4% in October. The inflation reading was in line with expectations, per a Reuters poll. On a year-over-year basis, core inflation, which excludes prices of volatile items such as fresh food and energy, increased 2.2% in November.
Economic Scenario
The surge in consumer prices seems to be driven by an increase in oil and food prices. Oil prices have been relatively stable of late, owing to the recent supply cut extension by OPEC. Moreover, talks of OPEC working on an exit strategy for its supply cut have provided support to crude prices. Fading prospects of an abrupt end to the production cut deal when the excess inventories are cleared out led to a rally in crude prices.
Transport costs surged 10.8% year over year in November and food and non-alcoholic beverages costs increased 4.0%.
Malaysia’s Department of Statistics said that the country’s GDP grew 6.2% year over year in the third quarter of 2017 compared with 5.8% in the second quarter and 4.3% in the year-ago quarter. Malaysia’s central bank, Bank Negara Malaysia (BNM), left its Overnight Policy Rate (OPR) unchanged at 3.00% in its last policy meeting. The World Bank projects Malaysia’s 2017 GDP growth at 5.8% (read: Malaysia's GDP at 3-Year High: ETFs in Focus).
Moreover, manufacturing PMI in Malaysia increased to 52.0 in November from 48.6 in October. A reading above 50 indicates expansion.
A Rate Hike in the Cards?
The Federal Reserve recently hiked its interest rate by 25 basis points in the December meeting. This is expected to weigh on investments in emerging economies and create pressure on various South East Asian economies to adopt a rate hike stance, in sync with the developed world.
Moreover, the recent strength in inflation might prompt Malaysia’s central bank to hike rates in 2018. The consensus on the streets is for a rate hike in 2018. "Our base case assumes BNM will raise the OPR in 1Q18, followed by an extended pause before hiking it again in 2019," a Nikkei Asian review article citing a CIMB Investment Bank statement read.
Let us now discuss the ETFs providing exposure to Malaysian equities (see all the Asia Pacific ETFs here).
iShares MSCI Malaysia ETF EWM
This fund is a pure play on Malaysia and is appropriate for those looking to gain exposure to this emerging market.
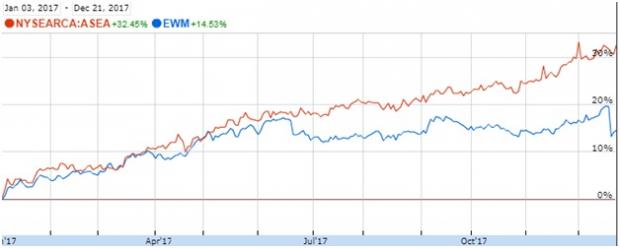
EWM has AUM of $473.1 million and charges a fee of 48 basis points a year. From a sector look, Financials, Utilities and Consumer Staples are the top three allocations of the fund, with 31.8%, 13.9% and 11.6% exposure, respectively (as of Dec 20, 2017). From an individual holdings perspective, Public Bank, Tenaga Nasional Bhd and Malayan Banking are the top three holdings of the fund, with 12.0%, 10.0%, and 8.0% allocation, respectively (as of Dec 20, 2017). The fund has returned 14.5% year to date and 9.3% in a year (as of Dec 21, 2017). EWM has a Zacks Rank #3 (Hold) with a Medium risk outlook.
We will now compare the performance of EWM with a broad-based South East Asian ETF, ASEA.
Global X Southeast Asia ETF ASEA
This fund provides broad exposure to the five members of the Association of Southeast Asian Nations, namely, Singapore, Indonesia, Malaysia, Thailand and the Philippines. It is appropriate for investors looking for diversified exposure to South East Asia.
ASEA is less popular with AUM of $16.7 million and charges a fee of 65 basis points a year. From a geographical perspective, the fund has 30.1% exposure to Singapore, 22.2% to Thailand, 22.1% to Malaysia, 19.2% to Indonesia and 6.5% to the Philippines (as of Sep 30, 2017). Financials, Telecommunication Services and Industrials are the top three sectors of the fund, with a 46.2%, 14.8% and 8.3% allocation, respectively (as of Sep 30, 2017). DBS Group Holdings Ltd, Oversea-Chinese Banking Ltd and United Overseas Bank Ltd are the top three holdings of the fund, with an allocation of 8.1%, 7.4% and 6.1%, respectively (as of Dec 21, 2017). The fund has returned 29.6% in a year and 32.5% year to date (as of Dec 21, 2017). ASEA has a Zacks Rank #3 with a Medium risk outlook.
Below is a chart comparing the year-to-date performance of the two funds.
Want key ETF info delivered straight to your inbox?
Zacks’ free Fund Newsletter will brief you on top news and analysis, as well as top-performing ETFs, each week. Get it free >>
Palantir remains highly valued with a 460x P/E ratio and a 42.5x P/B ratio, far above its peers. The stock's beta of 2.81 signals high volatility, meaning sharp moves in both...
The S&P 500 had started to clear resistance, posting new all-time highs before sellers struck with a vengeance. The selling was bad, similar to that seen in December, which...
Myself and others have highlighted how European Equities have been breaking out to new all-time highs on the back of bullish factors such as cheap valuations, monetary tailwinds,...
Are you sure you want to block %USER_NAME%?
By doing so, you and %USER_NAME% will not be able to see any of each other's Investing.com's posts.
%USER_NAME% was successfully added to your Block List
Since you’ve just unblocked this person, you must wait 48 hours before renewing the block.
I feel that this comment is:
Thank You!
Your report has been sent to our moderators for review
Add a Comment
We encourage you to use comments to engage with other users, share your perspective and ask questions of authors and each other. However, in order to maintain the high level of discourse we’ve all come to value and expect, please keep the following criteria in mind:
Enrich the conversation, don’t trash it.
Stay focused and on track. Only post material that’s relevant to the topic being discussed.
Be respectful. Even negative opinions can be framed positively and diplomatically. Avoid profanity, slander or personal attacks directed at an author or another user. Racism, sexism and other forms of discrimination will not be tolerated.
Perpetrators of spam or abuse will be deleted from the site and prohibited from future registration at Investing.com’s discretion.