
During the recent deep recession and slow recovery, U-6, an alternative measure of unemployment issued by the Bureau of Labor Statistics, has received increased attention. People often refer to U-6, which includes several groups of workers in addition to the officially unemployed, as the “broad unemployment rate.” No doubt, part of its popularity stems from the simple fact that the broad measure of joblessness makes the employment situation look worse than the standard one, and bad news attracts readers and viewers. Beyond that, thought, just what does U-6 really add to our understanding of labor market conditions?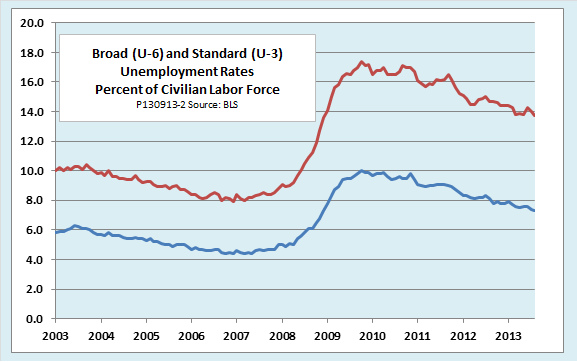
What U-6 tells us
The main contribution of U-6, as I see it, is to remind us that those whom the BLS defines as unemployed—those who are not working for pay even an hour a week but have looked for work within the last four weeks—are not the only ones who suffer when labor markets are weak. U-6 brings in two groups of people who feel labor market distress even though they do not fit the official definition of unemployed:
- Those who are working part-time “for economic reasons,” that is, who would prefer to work full time but are not doing so because they cannot find a full-time job or because their employer has cut their hours.
- Those who are “marginally attached to the labor force,” that is, who would like a job, are available for work, and have looked for work in the past year but not in the past four weeks. “Discouraged workers” are a subset of the marginally attached who have not recently looked for work because they think none is available. The remaining marginally attached workers have other reasons for not actively looking for work. The BLS adds marginally attached workers to both the numerator and the denominator of U-6.
Popular accounts often focus on the discouraged worker component of U-6, but in practice, as the next chart shows, involuntary part-time work is the most important added category. The top line in the chart shows the gap between U-6 and U-3. The next line, which shows involuntary part-time workers as a percentage of the labor force, almost entirely fills the gap. It is responsible both for most of the rise in U-6 during the recession and most of its gradual decline during the recovery. The third line, which shows marginally attached workers, contributes relatively little either to the U6-U3 gap or to its change over the cycle.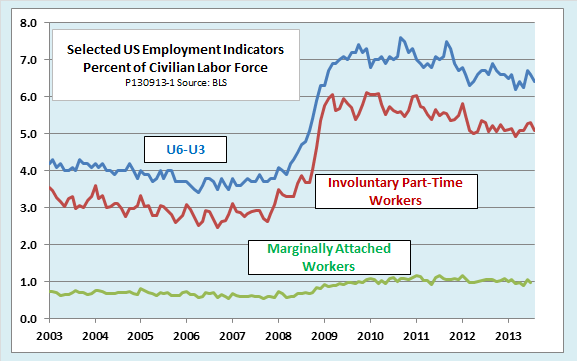
Furthermore, it is worth noting that discouraged workers, as defined by the BLS, make up only about a third of all marginally attached workers, whatever the state of the business cycle. In March 2007, when unemployment was at its prerecession low of 4.4 percent, marginally attached workers accounted for 0.6 percent of the labor force, of which just .17 percentage points represented discouraged workers. More recently, in July 2013, the marginally attached were .99 percent of the labor force, with discouraged workers accounting for .37 percentage points. As the next chart shows, the number of discouraged workers peaked at about half a percent of the labor force in December 2010. The remaining marginally attached workers did not look for work for other reasons than a belief that there was no work to be found, that is, for reasons such as ill health, family responsibility, school, or transportation problems.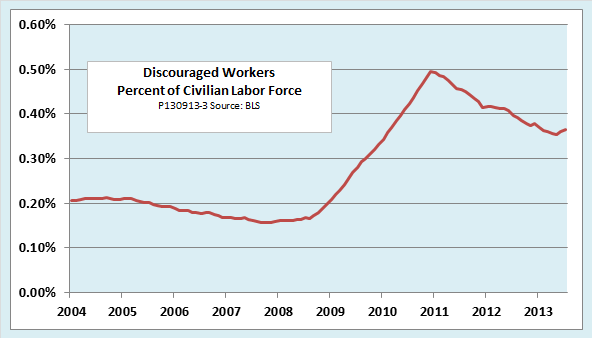
What U-6 does not tell us: Those who want a job but are not looking at all
Although U-6 covers involuntary part-time workers, discouraged workers, and other marginally attached workers, it misses two other groups who suffer economic stress as the result of a weak labor market.
One of those groups consists of people who say they want a job but who are excluded from U-6 because they have not looked for work in the past 12 months or are not currently available for work. The number of such people, shown in the next chart, is equal to the total number who are not in the labor force but want a job minus the number of marginally attached workers. Some people think that anyone who wants a job but does not have one should be included in a broad measure of unemployment. For example, we could construct a hypothetical U-7 that included in its numerator the officially unemployed, the involuntary part-timers, and all those outside the labor force who want a job, and in its numerator, the civilian labor force plus all those not in the labor force who want a job. However, two considerations would limit the usefulness of such a measure.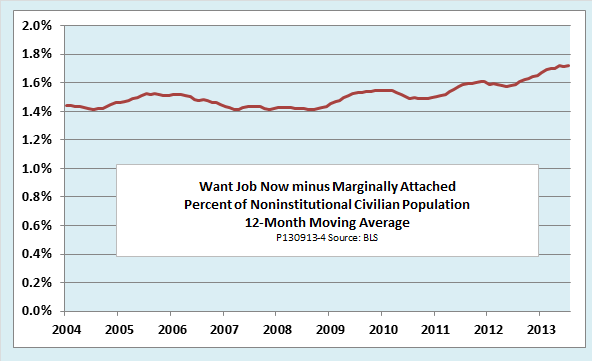
First, as the chart shows, the number of those who want a job but do not qualify as marginally attached is not especially large nor does it vary much over the business cycle. For that reason, adding these people would not greatly change the picture of the employment situation that we get from U-6.
Second, these people, despite their declared desire for a job, are even more loosely attached to the labor force than those the BLS officially classifies as “marginally” attached. Keep in mind that the BLS standards for actively looking for work are rather low. For example, answering one job ad a year, contacting an employment agency even once, or simply asking a friend or a relative about job openings once a year is enough to keep a person in the marginally attached category. Perhaps we could describe those who do not meet that standard, but who still say they want a job, as “attached by a thread.”
Some of those hanging to the labor force by a thread may be suffering great economic distress but are so discouraged about work prospects that they will not lift a finger to look for a job. Others presumably have other sources of income (family, savings, government assistance, or whatever) and want to work only in the sense that if just the right job fell into their lap, they would take it. The BLS does not provide the data we would need to make such distinctions.
What U-6 does not tell us: Those who are working full time but underemployed
Another group who suffer distress in a weak job market, but are not covered by U-6, consists of people who are working at a job that does not make full use of their potential. Both anecdotal evidence and systematic studies suggest that the number of such persons is substantial and is higher now than before the recession.
For example, a study by Richard Vedder, Christopher Denhart, and Jonathan Robe that was released earlier this year by the Center on College Affordability and Productivity shows surprisingly large numbers of college graduates in occupations that do not usually require a college degree, such as taxi drivers (15 percent), retail clerks (24 percent), and firefighters (18 percent). All together, the Vedder study claims that as many as 48 percent of all college graduates are employed in occupations that require less than a college degree.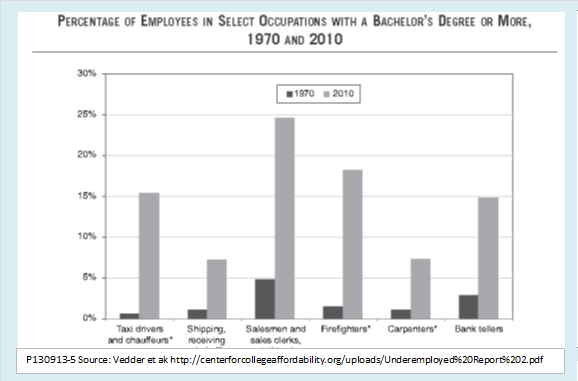
Vedder et al. point out that we can view these data in two ways. On the one hand, they can be seen as a a cyclical phenomenon, in the sense that a weak job market pushes college graduates into occupations that do not make use of their skills. On the other hand, the data can be seen as a symptom of secular overinvestment in education. They suggest that a “college for all” mentality may be running up against diminishing returns, so that the number of graduates (at least in some fields) is growing faster than demand regardless of the state of the business cycle.
Whatever the reason, though, there is some sense in which a person with an accounting degree who is working full-time as a sales clerk is as much underemployed as a classmate who is working short hours as an accountant. In principle, it would be nice to have some “U-8” or other measure that captured that kind of underemployment, but there do not seem to be any easily available data that would allow us to construct such an index.
The bottom line
When all is said and done, what we really learn from looking closely at U-6 is that unemployment is inherently a difficult concept to pin down. Different measures each catch a different group of people who fail to find what they want or need in the labor market. The broader measures are better in the sense that they miss fewer people who suffer economic stress because of a weak labor market. At the same time, the broader the measure, the more it dilutes the common sense notion of unemployment as a situation of looking for work and being unable to find it. In the end, we learn more by looking at a number of different indicators than by trying to synthesize them into one “true” unemployment rate.
Original post