
Signals are automatically generated by integrating electronic weekly statistics with proprietary algorithms.
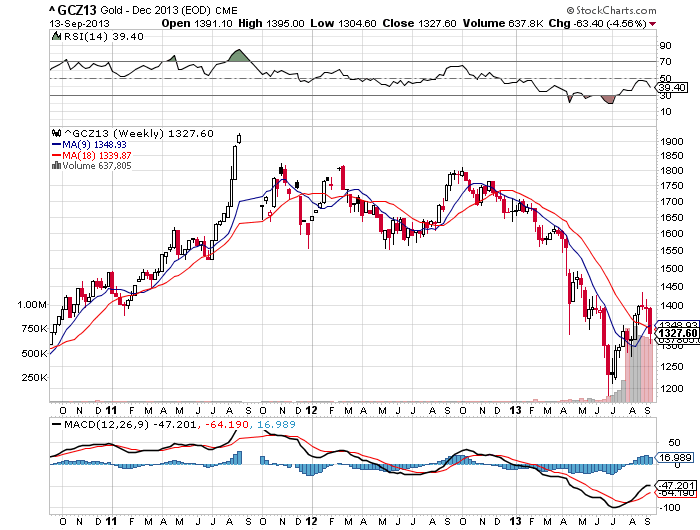
GOLD
WEEKLY MOVING AVERAGES
The December gold futures contract closed at 1328. The market closing below the 18 MA (1340) is confirmation that the trend momentum is bearish. A close above the 18 MA would negate the weekly bearish short-term trend to neutral.
VC CODE WEEKLY MOMENTUM INDICATOR
With the market closing below the VC Weekly Price Momentum Indicator of 1343 it confirms that the price momentum is bearish.
VC CODE WEEKLY CODE PRICE INDICATOR
Cover short on corrections at the 1290 to 1253 levels and go long on a weekly reversal stop. If long, use the 1253 level as a Stop Close Only and Good Till Cancelled order. Look to take some profits on longs, as we reach the 1380 to 1433 levels during the week.
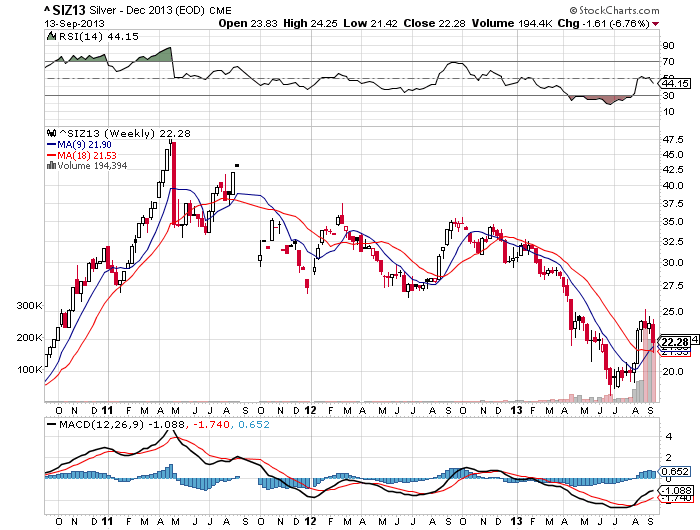
SILVER
WEEKLY MOVING AVERAGES
The December Silver futures contract closed at 22.28. The market closing above the 9 day MA (21.90) is confirmation that the trend momentum is bullish. A close below the 9 MA would negate the weekly bullish short-term trend to neutral.
VC CODE WEEKLY MOMENTUM INDICATOR
With the market closing below the VC Weekly Price Momentum Indicator of 22.65, it confirms that the price momentum is bearish.
VC CODE WEEKLY CODE PRICE INDICATOR
Cover short on corrections at the 21.05 to 19.82 levels and go long on a weekly reversal stop. If long, use the 19.82 level as a Stop Close Only and Good Till Cancelled order. Look to take some profits on longs, as we reach the 23.88 to 25.48 levels during the week.
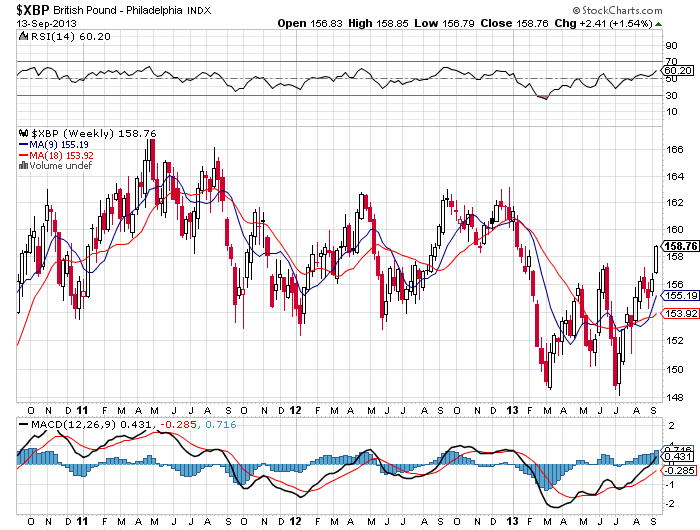
B POUND
WEEKLY MOVING AVERAGES
The B Pound – PA Index contract closed at 158.76. The market closing above the 18 day MA (153.92) is confirmation that the trend momentum is bullish. A close below the 18 MA would negate the weekly bullish short-term trend to neutral.
VC CODE WEEKLY MOMENTUM INDICATOR
With the market closing above the VC Weekly Price Momentum Indicator of 158.13 it confirms that the price momentum is bullish.
VC CODE WEEKLY PRICE INDICATOR
Cover short on corrections at the 157.42 to 156.07 levels and go long on a weekly reversal stop. If long, use the 156.07 level as a Stop Close Only and Good Till Cancelled order. Look to take some profits on longs, as we reach the 159.48 to 160.19 levels during the week.
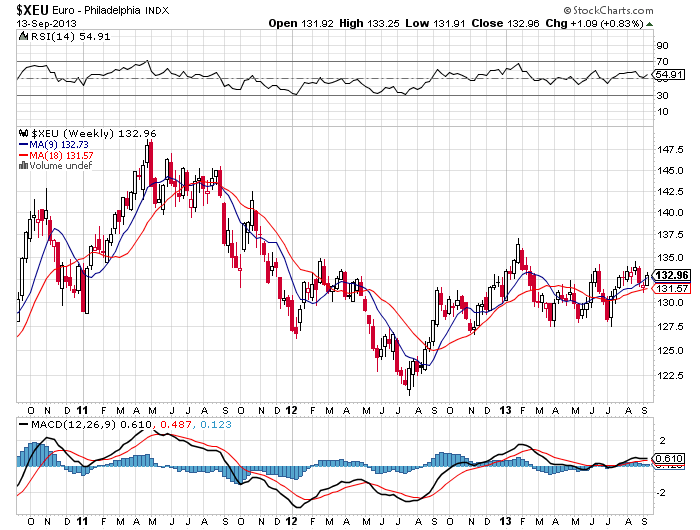
EURO
WEEKLY MOVING AVERAGES
The Euro – PA Index contract closed at 132.96. The market closing above the 9 day MA (132.73) is confirmation that the trend momentum is bullish. A close below the 18 MA would negate the weekly bullish short-term trend to neutral.
VC CODE WEEKLY MOMENTUM INDICATOR
With the market closing above the VC Weekly Price Momentum Indicator of 132.70, it confirms that the price momentum is bullish.
VC CODE WEEKLY PRICE INDICATOR
Cover short on corrections at the 132.15 to 131.35 levels and go long on a weekly reversal stop. If long, use the 131.35 level as a Stop Close Only and Good Till Cancelled order. Look to take some profits on longs, as we reach the 133.51 to 134.05 levels during the week.
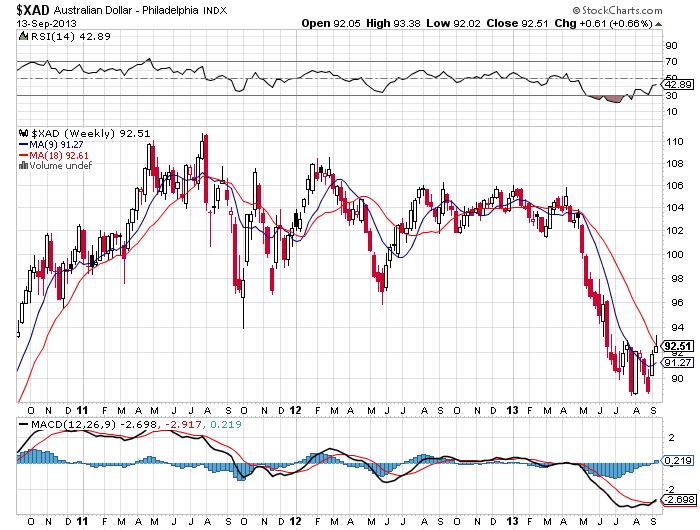
AUSTRALIAN DOLLAR
WEEKLY MOVING AVERAGES
The Australian dollar – PA Index contract closed at 92.51. The market closing above the 18 MA (91.27) is confirmation that the trend momentum is bullish. A close below the 18 MA would negate the weekly bullish trend to neutral.
VC CODE WEEKLY MOMENTUM INDICATOR
With the market closing below the VC Weekly Price Momentum Indicator of 92.80, it confirms that the price momentum is bearish.
VC CODE WEEKLY PRICE INDICATOR
Cover shorts on corrections at the 92.22 to 91.93 levels and go long on a weekly reversal stop. If long, use the 91.53 level as a Stop Close Only and Good Till Cancelled order. Look to take some profits, if long, as we reach the 93.09 to 93.67 levels during the week.
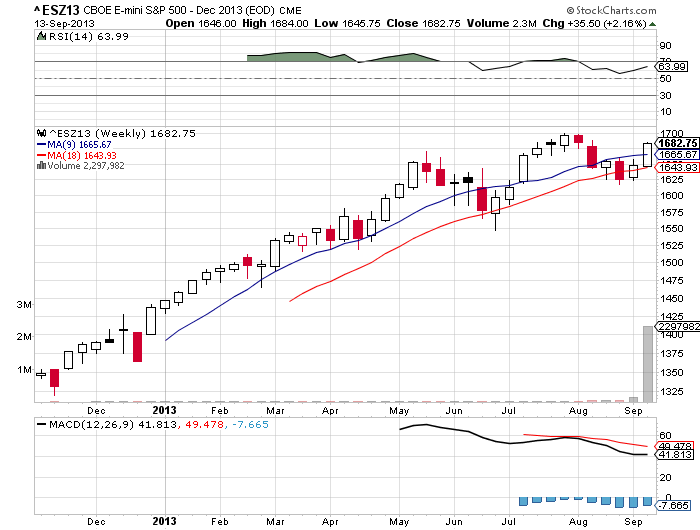
E MINI S&P 500
WEEKLY MOVING AVERAGES
The Dec E Mini futures contract closed at 1.683. The market closing above the 18 day MA (1.644) is confirmation that the trend momentum is bullish. A close below the 18 MA would negate the weekly bullish short-term trend to neutral.
VC CODE WEEKLY MOMENTUM PRICE INDICATOR
With the market closing above the VC Weekly Price Momentum Indicator of 1.671, it confirms that the price momentum is bullish.
VC CODE WEEKLY PRICE INDICATOR
Cover short on corrections at the 1.659 to 1.634 levels and go long on a weekly reversal stop. If long, use the 1.634 level as a Stop Close Only and Good Till Cancelled order. Look to take some profits on longs, as we reach the 1.696 to 1.708 levels during the week.
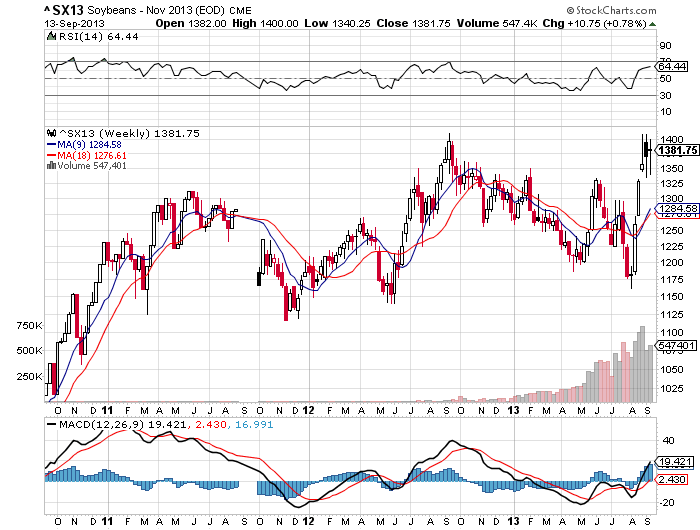
SOYBEANS
WEEKLY MOVING AVERAGES
The Nov Soybeans futures contract closed at 13.82. The market closing above the 9 day MA (12.85) is confirmation that the trend momentum is bullish. A close below the 9 MA would negate the weekly bullish short-term trend to neutral.
VC CODE WEEKLY MOMENTUM INDICATOR
With the market closing above the VC Weekly Price Momentum Indicator of 13.74, it confirms that the price momentum is bullish.
VC CODE WEEKLY PRICE INDICATOR
Cover short on corrections at the 14.08 to 14.34 levels and go long on a weekly reversal stop. If long, use the 14.34 level as a Stop Close Only and Good Till Cancelled order. Look to take some profits on longs, as we reach the 13.48 to 13.14 levels during the week.
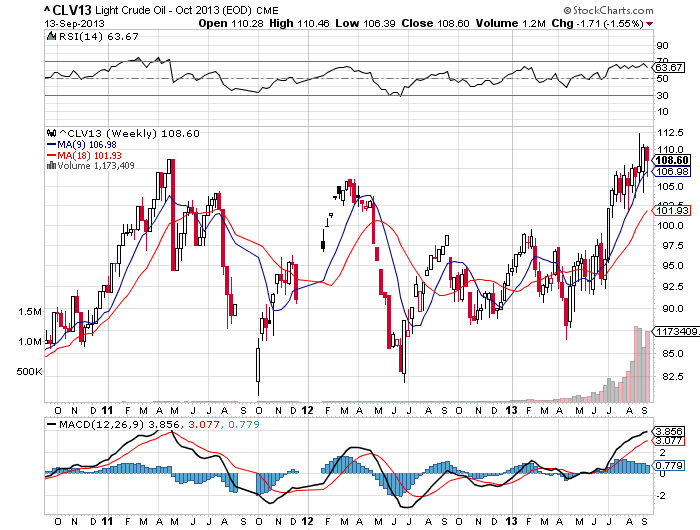
CRUDE OIL
WEEKLY MOVING AVERAGES
The October Crude Oil contract closed at 108.6. The market closing above the 9 MA (106.98) is confirmation that the trend momentum is bullish. A close below the 9 MA would negate the weekly bullish trend to neutral.
VC CODE WEEKLY MOMENTUM INDICATOR
With the market closing above the VC Weekly Price Momentum Indicator of 108.48, it confirms that the price momentum is bullish.
VC CODE WEEKLY PRICE INDICATOR
Cover shorts on corrections at the 106.51 to 104.41 levels and go long on a weekly reversal stop. If long, use the 104.41 level as a Stop Close Only and Good Till Cancelled order. Look to take some profits, if long, as we reach the 110.58 to 112.55 levels during the week.
Disclosure: Trading Derivatives, Financial Instruments And Precious Metals Involves Significant Risk Of Loss And Is Not Suitable For Everyone. Past Performance Is Not Necessarily Indicative Of Future Results.
- English (UK)
- English (India)
- English (Canada)
- English (Australia)
- English (South Africa)
- English (Philippines)
- English (Nigeria)
- Deutsch
- Español (España)
- Español (México)
- Français
- Italiano
- Nederlands
- Português (Portugal)
- Polski
- Português (Brasil)
- Русский
- Türkçe
- العربية
- Ελληνικά
- Svenska
- Suomi
- עברית
- 日本語
- 한국어
- 简体中文
- 繁體中文
- Bahasa Indonesia
- Bahasa Melayu
- ไทย
- Tiếng Việt
- हिंदी
Weekly Futures Swing Trading Instructions: Gold Price Momentum Bearish
Published 09/13/2013, 02:47 PM
Updated 07/09/2023, 06:31 AM
Weekly Futures Swing Trading Instructions: Gold Price Momentum Bearish
Latest comments
Loading next article…
Install Our App
Risk Disclosure: Trading in financial instruments and/or cryptocurrencies involves high risks including the risk of losing some, or all, of your investment amount, and may not be suitable for all investors. Prices of cryptocurrencies are extremely volatile and may be affected by external factors such as financial, regulatory or political events. Trading on margin increases the financial risks.
Before deciding to trade in financial instrument or cryptocurrencies you should be fully informed of the risks and costs associated with trading the financial markets, carefully consider your investment objectives, level of experience, and risk appetite, and seek professional advice where needed.
Fusion Media would like to remind you that the data contained in this website is not necessarily real-time nor accurate. The data and prices on the website are not necessarily provided by any market or exchange, but may be provided by market makers, and so prices may not be accurate and may differ from the actual price at any given market, meaning prices are indicative and not appropriate for trading purposes. Fusion Media and any provider of the data contained in this website will not accept liability for any loss or damage as a result of your trading, or your reliance on the information contained within this website.
It is prohibited to use, store, reproduce, display, modify, transmit or distribute the data contained in this website without the explicit prior written permission of Fusion Media and/or the data provider. All intellectual property rights are reserved by the providers and/or the exchange providing the data contained in this website.
Fusion Media may be compensated by the advertisers that appear on the website, based on your interaction with the advertisements or advertisers.
© 2007-2024 - Fusion Media Limited. All Rights Reserved.