


Sign up to create alerts for Instruments,
Economic Events and content by followed authors
Free Sign Up Already have an account? Sign In
Please try another search

General Dynamics Corporation (NYSE:GD) reported third-quarter 2017 earnings from continuing operations of $2.52 per share, beating the Zacks Consensus Estimate of $2.43 by 3.7%. Reported earnings were up 6.8% from $2.36 recorded in the year-ago quarter.
Total Revenues
General Dynamics’ third-quarter total revenues of $7,580 million missed the Zacks Consensus Estimate of $7,892 million by 4%. Reported revenues also dipped 1% from $7,657 million in the year-ago quarter.
General Dynamics Corporation Price, Consensus and EPS Surprise
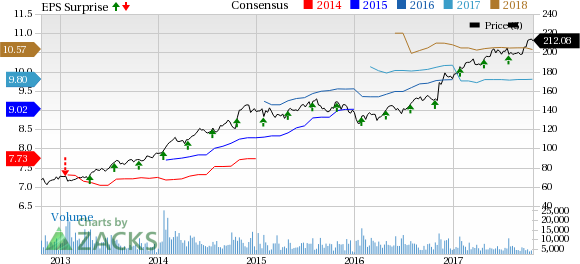
General Dynamics Corporation Price, Consensus and EPS Surprise | General Dynamics Corporation Quote
Backlog
The company recorded a total backlog of $63.9 billion, down a mere 0.2% year over year. Funded backlog at the quarter end was down 1% to $52.7 billion.
Segment Performance
Aerospace: The segment reported revenues of $1,995 million, up 3.6% year over year. Operating earnings of $385 million increased 2.1% from the prior-year recorded figure of $377 million.
Combat Systems: Segment revenues rose 13% to $1,500 million. Operating earnings were up 18.2% to $247 million in the quarter.
Information Systems and Technology: The segment reported revenues of $2,154 million, down 7.6%. Operating income rose 5.9% to $253 million.
Marine Systems: The segment’s revenues of $1,931 million were down 6.9% from the year-ago figure of $2, 075 million. Operating income also dropped 9.1% to $179 million.
Operational Highlights
Company-wide operating margin expanded 60 basis points (bps) to 13.9% from the year-ago level of 13.3%.
In the quarter under review, General Dynamics’ operating costs and expenses declined 1.7% to $6,528 million.
Financial Condition
As of Oct 1, 2017, General Dynamics’ cash and cash equivalents were $2,722 million compared with $2,334 million as of Dec 31, 2016.
Long-term debt as of Oct 1, 2017 was $3,979 million, up from the 2016-end level of $2,988 million.
As of Oct 1, 2017, the company’s cash flow from operating activities was around $1,881 million compared with $1,372 million in the year-ago period.
Free cash flow from operations at the end of the third quarter was $751 million, compared with $389 million in the previous year.
Zacks Rank
General Dynamics currently carries a Zacks Rank #3 (Hold).You can see the complete list of today’s Zacks #1 (Strong Buy) Rank stocks here.
Upcoming Peer Releases
Huntington Ingalls Industries, Inc. (NYSE:HII) is expected to report third-quarter 2017 results on Nov 8. The company surpassed the Zacks Consensus Estimate in the trailing four quarters, with a positive average surprise of 8.56%. It has a solid long-term earnings growth rate of 15%.
Recent Peer Release
Lockheed Martin Corp. (NYSE:LMT) reported third-quarter 2017 earnings from continuing operations of $3.24 per share, which missed the Zacks Consensus Estimate of $3.25 by 0.3%. In the quarter, total revenues came in at $12.17 billion, which missed the Zacks Consensus Estimate of $12.83 billion by 5.1%.
Textron Inc. (NYSE:TXT) recently reported third-quarter 2017 adjusted earnings from continuing operations of 65 cents per share, beating the Zacks Consensus Estimate of 62 cents by 4.8%. Total revenues in the quarter were $3.48 billion, which missed the Zacks Consensus Estimate of $3.54 billion by 1.5%.
Zacks' Hidden Trades
While we share many recommendations and ideas with the public, certain moves are hidden from everyone but selected members of our portfolio services. Would you like to peek behind the curtain today and view them?
Starting now, for the next month, I invite you to follow all Zacks' private buys and sells in real time from value to momentum...from stocks under $10 to ETF to option movers...from insider trades to companies that are about to report positive earnings surprises (we've called them with 80%+ accuracy). You can even look inside portfolios so exclusive that they are normally closed to new investors.
Click here for Zacks' secret trade>>
The fortune of Nvidia (NASDAQ:NVDA) is closely tied to Big Tech hyperscalers. Although the AI/GPU designer didn’t name its largest clients in the latest 10-K filing on Wednesday,...
Home improvement retailers Lowe’s (NYSE:LOW) and Home Depot (NYSE:HD) turned a corner, and their Q4 2024 earnings reports confirmed it. The corner is a return to comparable store...
One of our old flames, a former Contrarian Income Portfolio holding, has pulled back sharply in recent weeks. Time to buy the dip in this 4.3% dividend? Let’s discuss. Kinder...
Are you sure you want to block %USER_NAME%?
By doing so, you and %USER_NAME% will not be able to see any of each other's Investing.com's posts.
%USER_NAME% was successfully added to your Block List
Since you’ve just unblocked this person, you must wait 48 hours before renewing the block.
I feel that this comment is:
Thank You!
Your report has been sent to our moderators for review
Add a Comment
We encourage you to use comments to engage with other users, share your perspective and ask questions of authors and each other. However, in order to maintain the high level of discourse we’ve all come to value and expect, please keep the following criteria in mind:
Enrich the conversation, don’t trash it.
Stay focused and on track. Only post material that’s relevant to the topic being discussed.
Be respectful. Even negative opinions can be framed positively and diplomatically. Avoid profanity, slander or personal attacks directed at an author or another user. Racism, sexism and other forms of discrimination will not be tolerated.
Perpetrators of spam or abuse will be deleted from the site and prohibited from future registration at Investing.com’s discretion.