TreeHouse Foods, Inc. (NYSE:) has been in hot waters for a while now due to a drab sales trend. Sales of the company have been bearing the brunt of softness in the Baked Goods and Meal Solutions segments. Also, the company has been witnessing a strained gross margin for the last few quarters. These factors along with an unimpressive sales guidance have been weighing on investors’ sentiments.
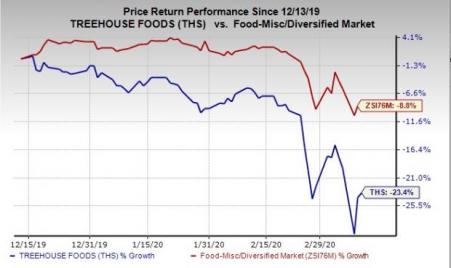
Shares of this Zacks Rank #5 (Strong Sell) company have lost 23.4% in the past three months, wider than the industry’s decline of 8.8%. Let’s delve deeper.
Will Dismal Sales Continue?TreeHouse Foods’ fourth-quarter 2019 results marked its 11th consecutive quarter of year-over-year sales decline. During the quarter, net sales of $1,139.5 million missed the consensus mark of $1,161 million and fell 4.5% year over year. The downside was caused by the adverse impacts of SKU rationalization. Organic sales fell 3.8%, primarily due to adverse volume/mix. Volumes declined on soft private-label performance, stemming from unfavorable pricing and merchandising actions in the retail space. Additionally, the beverage segment delivered a lower-than-expected performance.
Further, the company has been struggling with sluggish Baked Goods and Meal Solutions units. Sales at the Baked Goods segment fell 4.4% year over year in the fourth quarter, whereas net sales at the Meals Solutions unit declined 3.5%. Sales at both segments were hurt by adverse volume/mix. Apart from this, the Baked Goods segment sales were hurt by SKU rationalization efforts and the Meals Solutions unit bore the brunt of currency headwinds.
For 2020, management expects sales of $4.10-$4.40 billion, down from $4288.9 million (nearly $4.29 billion) reported in 2019. Notably, management expects net sales to decline 3-5% in the first half of 2020. For the first quarter, net sales are expected in a band of $0.98-$1.02 billion compared with $1,301.1 million (nearly $1.30 billion) reported in the first quarter of 2019.
Gross Margin Under Pressure
TreeHouse Foods’ gross margin has been contracting year over year for the last few quarters. In fourth-quarter 2019, gross margin contracted 130 basis points to 19.8% due to lower volumes and increased expenses related to change in regulatory requirements. Prior to this, the metric contracted 150 bps, 30 bps and 70 bps in the third, second and first quarters of 2019, respectively, mainly due to fixed cost impact of soft volumes.
Wrapping UpTreeHouse Foods is working on improving performance through portfolio refinement and focus on healthy product offerings. Also, the company’s Structure to Win cost-reduction initiative is on track. Let’s see if these strategies can help the company tide over the aforementioned hurdles.
3 Food Stocks You Can’t Miss Darling Ingredients (NYSE:) , with a Zacks Rank #1 (Strong Buy), delivered a positive earnings surprise in the last reported quarter. You can see
the complete list of today’s Zacks #1 Rank stocks here.Lamb Weston (NYSE:) has a long-term earnings growth rate of 8.8% and a Zacks Rank #2 (Buy).
Hain Celestial (NASDAQ:) , with a Zacks Rank #2, delivered a positive earnings surprise of 7%, on average, in the trailing four quarters.
The Hottest Tech Mega-Trend of All Last year, it generated $24 billion in global revenues. By 2020, it's predicted to blast through the roof to $77.6 billion. Famed investor Mark Cuban says it will produce ""the world's first trillionaires,"" but that should still leave plenty of money for regular investors who make the right trades early.
See Zacks' 3 Best Stocks to Play This Trend >>The Hain Celestial Group, Inc. (HAIN): Free Stock Analysis ReportDarling Ingredients Inc. (DAR): Free Stock Analysis ReportTreeHouse Foods, Inc. (THS): Free Stock Analysis ReportLamb Weston Holdings Inc. (LW): Free Stock Analysis ReportOriginal postZacks Investment Research


Add a Comment
We encourage you to use comments to engage with other users, share your perspective and ask questions of authors and each other. However, in order to maintain the high level of discourse we’ve all come to value and expect, please keep the following criteria in mind:
Enrich the conversation, don’t trash it.
Stay focused and on track. Only post material that’s relevant to the topic being discussed.
Be respectful. Even negative opinions can be framed positively and diplomatically. Avoid profanity, slander or personal attacks directed at an author or another user. Racism, sexism and other forms of discrimination will not be tolerated.
Perpetrators of spam or abuse will be deleted from the site and prohibited from future registration at Investing.com’s discretion.