As the Federal Reserve continues to prop up the highly leveraged debt based financial industry, the flow of U.S. gold heading East picked up significantly. According to the USGS most recently released survey, Hong Kong received 56% of total U.S. gold bullion exports in September.
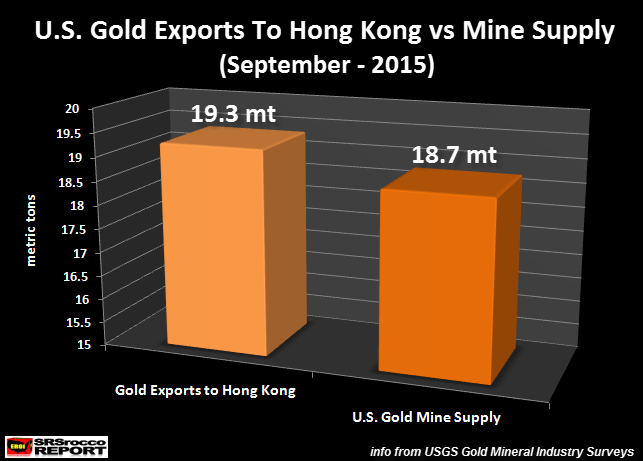
Actually, U.S. gold bullion shipments to Hong Kong where so large they exceeded its total domestic mine supply in September:

As we can see, the U.S. exported 19.3 metric tons (mt) of gold bullion to Hong Kong, while its total domestic mine supply was only 18.7 mt. The other top sources of U.S. gold exports were:
Switzerland = 11.4 mt
United Kingdom = 6.9 mt
India = 5.7 mt
U.A.E = 1 mt
Not all of U.S. gold shipments were in bullion form, some were exported as dore bars. Dore bars are semi-pure gold bars poured at the mines requiring additional refinement. India received 5.6 mt of gold dore bars from the U.S. while Switzerland imported 4.3 mt and the U.A.E, almost one metric ton.
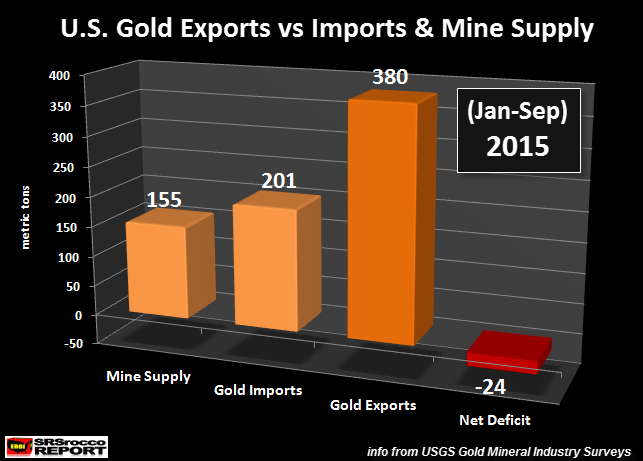
That being said, the U.S. continues to export more gold than it imports or produces from domestic mines. For the first nine months of the year, the U.S. suffered a 24 mt deficit as it exported 380 mt of gold versus 155 mt from its domestic mine supply and 201 mt it received in gold imports:

Not only is the U.S. exported more gold than it produces, Australia is doing the very same thing. Of the 214 mt of gold exported from Australia during the first nine months of the year, China (and Hong Kong) received 136 mt or 64% of the total. Total Australian gold exports went to the following countries:
Australian Gold Exports (Jan-Sep 2015):
China = 136 mt
Singapore = 34.7 mt
India = 15.4
Thailand = 12.2 mt
United Kingdom = 6.4 mt
Total Australian gold mine supply during this period was only 205.2 mt (source: Australian Government Resources & Energy Quarterly Report). Even though Australia does import gold, here is another example of a Western country exported 100%+ of its domestic mine supply to the East.
Why is this interesting? Because two of the top four gold producing countries in the world exported the majority of their gold supply. Let’s look at the top four gold producing countries below (wikipedia):
Top 4 Gold Producing Countries 2014:
China = 450 mt
Australia = 270 mt
Russia = 245 mt
United States = 211 mt
We know that all of China’s gold mine supply stays in the country, so does the majority of Russia’s. However, Australia and the United States exports the majority of their domestic mine supply. Which means, the East continues to trade worthless fiat money or U.S. Treasuries for gold while the West manufactures more paper derivatives and debt.
Unfortunately, this is not a sustainable financial or economic business model for the West. While precious metal investors are frustrated by the low paper price of gold and silver, there is light at the end of the tunnel.
