


Sign up to create alerts for Instruments,
Economic Events and content by followed authors
Free Sign Up Already have an account? Sign In
Please try another search

Retail real estate investment trust (REIT) Taubman Centers Inc. (NYSE:TCO) reported fourth-quarter 2017 adjusted funds from operations (FFO) per share of $1.03 that surpassed the Zacks Consensus Estimate of $1.02. The figure also came 2% above the year-ago tally of $1.01.
Total revenues for the quarter came in at $172.2 million, beating the Zacks Consensus Estimate of $165 million. Revenues were also up 3.6% from the prior-year quarter.
The quarter experienced higher occupancy and rent per square foot, and lower general and administrative expenses.
For full-year 2017, Taubman’s adjusted FFO per share were $3.70, reflecting growth of 3.4% from the year-ago figure of $3.58. Further, it surpassed the Zacks Consensus Estimate by a penny.
Total revenues for the full year came in at $629.2 million, outpacing the Zacks Consensus Estimate of $612.5 million. The figure also grew 2.7% year over year.
Quarter in Detail
Comparable center net operating income (NOI) climbed 0.1% for the quarter. Average rent per square foot in comparable centers came in at $61.35, up 0.6% from the prior-year quarter. For the period ended Dec 31, 2017, the trailing 12-month releasing spreads per square foot were 5%.
Moreover, comparable center mall tenant sales per square foot inched up 3.2% in the quarter. Further, the company’s 12-month trailing comparable center mall tenant sales per square foot was $810, marking an increase of 2.3%.
As of Dec 31, 2017, leased space in comparable centers was 96%. Moreover, ending occupancy in comparable centers was 95% on Dec 31, 2017, reflecting a rise of 0.3% from the prior year.
Liquidity
Taubman Centers exited the fourth quarter with cash and cash equivalents of $42.5 million, up from $40.6 million at year-end 2016.
Guidance
Taubman Centers introduced guidance for 2018. The company projects 2018 FFO per share in the range of $3.72-$3.86. The Zacks Consensus Estimate is pegged at $3.78.
The full-year FFO per share guidance is backed by assumptions of comparable center NOI growth of about 2-3% for the year. Also, the guidance does not include any future costs that may be incurred related to shareowner activism.
Our Viewpoint
The company’s performance is anticipated to be adversely affected by the choppy retail real estate environment. In fact, with a rapid shift in customers’ shopping preferences and growing online purchases, mall traffic continues to suffer. These have made retailers reconsider their footprint and eventually opt for store closures. This is expected to impact demand for retail space at Taubman’s shopping centers. Also, hike in interest rates and unfavorable foreign-currency movements increase its risks.
Nonetheless, the company’s solid retail portfolio, high-quality retailers and diligent restructuring initiatives have the capacity to support its growth in the long term.
Taubman Centers, Inc. Price, Consensus and EPS Surprise
Taubman Centers has a Zacks Rank #4 (Sell).
You can see the complete list of today’s Zacks #1 Rank (Strong Buy) stocks here.
We now look forward to the earnings releases of other REITs like HCP Inc. (NYSE:HCP) , CubeSmart (NYSE:CUBE) and EPR Properties (NYSE:EPR) . HCP and CubeSmart are scheduled to release results on Feb 13 and Feb 15 respectively, while EPR Properties is slated to report numbers on Feb 28.
Note: Anything related to earnings presented in this write-up represent funds from operations (FFO) — a widely used metric to gauge the performance of REITs.
The Hottest Tech Mega-Trend of All
Last year, it generated $8 billion in global revenues. By 2020, it's predicted to blast through the roof to $47 billion. Famed investor Mark Cuban says it will produce "the world's first trillionaires," but that should still leave plenty of money for regular investors who make the right trades early.
See Zacks' 3 Best Stocks to Play This Trend >>
The fortune of Nvidia (NASDAQ:NVDA) is closely tied to Big Tech hyperscalers. Although the AI/GPU designer didn’t name its largest clients in the latest 10-K filing on Wednesday,...
Home improvement retailers Lowe’s (NYSE:LOW) and Home Depot (NYSE:HD) turned a corner, and their Q4 2024 earnings reports confirmed it. The corner is a return to comparable store...
One of our old flames, a former Contrarian Income Portfolio holding, has pulled back sharply in recent weeks. Time to buy the dip in this 4.3% dividend? Let’s discuss. Kinder...
Are you sure you want to block %USER_NAME%?
By doing so, you and %USER_NAME% will not be able to see any of each other's Investing.com's posts.
%USER_NAME% was successfully added to your Block List
Since you’ve just unblocked this person, you must wait 48 hours before renewing the block.
I feel that this comment is:
Thank You!
Your report has been sent to our moderators for review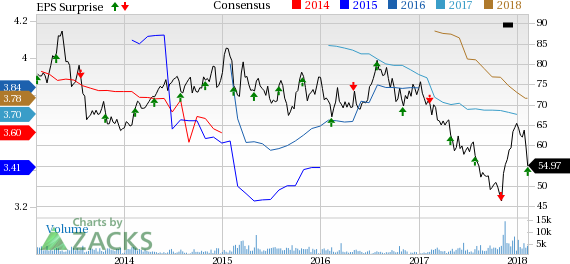

Add a Comment
We encourage you to use comments to engage with other users, share your perspective and ask questions of authors and each other. However, in order to maintain the high level of discourse we’ve all come to value and expect, please keep the following criteria in mind:
Enrich the conversation, don’t trash it.
Stay focused and on track. Only post material that’s relevant to the topic being discussed.
Be respectful. Even negative opinions can be framed positively and diplomatically. Avoid profanity, slander or personal attacks directed at an author or another user. Racism, sexism and other forms of discrimination will not be tolerated.
Perpetrators of spam or abuse will be deleted from the site and prohibited from future registration at Investing.com’s discretion.