
Following Synovus Financial’s (NYSE:SNV) second-quarter 2019 results, its shares have climbed 2.24%. Driven by top-line strength, the company reported a positive earnings surprise of 1.01%. Adjusted earnings of $1.00 per share beat the Zacks Consensus Estimate of 99 cents. Also, the reported figure comes in 8.4% higher than the prior-year quarter tally.
Higher revenues, backed by strong loan balances, stoked organic growth. Notably, lower efficiency ratio and rising fee income were tailwinds. However, escalating expenses and provisions were undermining factors.
Including certain non-recurring items, net income available to common shareholders came in at $153 million or 96 cents per share compared with $108.6 million or 91 cents per share recorded in the prior-year quarter.
Top Line Robust, Expenses Flare Up
Adjusted total revenues in the second quarter came in at $488.3 million, up 35.9% year over year. Further, the top-line figure outpaced the Zacks Consensus Estimate of $479 million.
Net interest income surged 39.6% year over year to $397.3 million. Yet, net interest margin shrunk 17 basis points year over year to 3.69%.
Non-interest income climbed 22.4% on a year-over-year basis to $89.8 million, including a favorable adjustment in the fair value of private equity investments. Rise in almost all components of income drove this upside.
Non-interest expenses came in at $264.1 million, flaring up 29.4% year over year. Notably, rise in almost all components of expenses resulted in this upswing.
Adjusted efficiency ratio came in at 52.08% as compared with 56.41% reported in the year-earlier quarter. A decline in ratio indicates improvement in profitability.
Total deposits came in at $38 billion, decreasing 1.1% sequentially. Total loans, however, climbed 5.7% sequentially to $36.1 billion.
Credit Quality: A Mixed Bag
Credit quality was a mixed a bag for Synovus in the June-end quarter.
Non-performing loans were up 5.8% year over year to $124.1 million. The non-performing loan ratio came in at 0.34%, contracting 13 bps year over year.
Total non-performing assets amounted to $139.6 million, underlining a rise of 10.5% year over year. The non-performing asset ratio shrunk 11 bps year over year to 0.39%.
Net charge-offs plunged 33.7% on a year-over-year basis to $11.8 million. The annualized net charge-off ratio was 0.13%, down 16 bps from the year-earlier quarter. Provision for loan losses was up 2.8% year over year to $12.1 million.
Strong Capital Position
Tier 1 capital ratio and total risk based capital ratio were 10.09% and 12.11%, respectively, compared with 11.25% and 13.08% as of Jun 30, 2018.
Also, as of Jun 30, 2019, Common Equity Tier 1 Ratio (fully phased-in) was 9.61% compared with 10.12% witnessed in the year-ago quarter. Tier 1 Leverage ratio was 8.92% compared with 10.03% recorded in the comparable period last year.
Capital Deployment Update
During the April-June quarter, the company increased the share repurchase authorization from $400 million to $725 million, and completed share buyback worth $25 million.
Our Take
Synovus’ results were quite decent in the June-end quarter. We believe the company’s focus on both organic and inorganic growth, together with its cost-containment efforts, will pay off and aid bottom-line expansion in subsequent years. Though escalating expenses raise concerns, lower efficiency ratio indicates optimism.
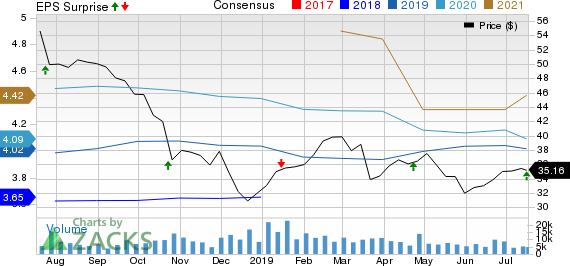
Synovus Financial Corp. Price, Consensus and EPS Surprise
Synovus Financial Corp. price-consensus-eps-surprise-chart | Synovus Financial Corp. Quote
Currently, Synovus carries a Zacks Rank #3 (Hold). You can see the complete list of today’s Zacks #1 Rank (Strong Buy) stocks here.Performance of Other Banks
Goldman Sachs’ (NYSE:GS) second-quarter results recorded a positive earnings surprise of 22.8%. The company reported earnings per share of $5.81, comfortably beating the Zacks Consensus Estimate of $4.73. Nevertheless, the bottom-line figure compared unfavorably with earnings of $5.98 per share recorded in the year-earlier quarter.
Citigroup (NYSE:C) delivered a positive earnings surprise of 2.8% in the second quarter, backed by expense control. Adjusted earnings per share of $1.83 for the quarter handily outpaced the Zacks Consensus Estimate of $1.78. Also, earnings climbed 12% year over year.
Driven by prudent expense management, Wells Fargo (NYSE:C) posted a positive earnings surprise of 12.1% in second-quarter 2019. Earnings of $1.30 per share surpassed the Zacks Consensus Estimate of $1.16. Results also came in higher than the prior-year quarter adjusted earnings of $1.08 per share.
Today's Best Stocks from Zacks
Would you like to see the updated picks from our best market-beating strategies? From 2017 through 2018, while the S&P 500 gained +15.8%, five of our screens returned +38.0%, +61.3%, +61.6%, +68.1%, and +98.3%.
This outperformance has not just been a recent phenomenon. From 2000 – 2018, while the S&P averaged +4.8% per year, our top strategies averaged up to +56.2% per year.
See their latest picks free >>
Citigroup Inc. (C): Free Stock Analysis Report
Wells Fargo & Company (NYSE:WFC): Free Stock Analysis Report
Synovus Financial Corp. (SNV): Free Stock Analysis Report
The Goldman Sachs Group, Inc. (GS): Free Stock Analysis Report
Original post