


Sign up to create alerts for Instruments,
Economic Events and content by followed authors
Free Sign Up Already have an account? Sign In
Please try another search

Industrial tool maker Stanley Black & Decker Inc. (NYSE:SWK) reported impressive results for the fourth quarter of 2017, with both earnings and sales beating their respective estimates. The bottom line in the quarter was primarily driven by organic sales growth and benefits from acquired assets.
Earnings, excluding acquisition related charges and others, in the fourth quarter came in at $2.18 per share, surpassing the Zacks Consensus Estimate of $2.14 by 1.9%. The figure also exceeded the year-ago quarter tally of $1.71 by 27.5%.
Average earnings surprise for the four quarters of 2017 is a positive 4.28%.
For 2017, the company’s earnings per share, excluding acquisition-related charges and others were $7.45, topping the Zacks Consensus Estimate of $7.40 by roughly 0.7%. On a year-over-year basis, the bottom line grew 14.4%.
Revenues Grow on Organic and Acquisition Gains
Net sales in the fourth quarter were $3,413.5 million, roughly 3.4% above the Zacks Consensus Estimate of $3.3 billion. Compared with the year-ago quarter, the top line grew 16.9%, primarily on the back of 9% volume gains, 3% positive currency impact and 9% gain from acquired assets, partially offset by 3% adverse impact from divested assets (Mechanical Security business in February 2017) and 1% from negative price impact.
Stanley Black & Decker reports revenues under three market segments. A brief discussion on the quarterly results is provided below:
Tools & Storage’s revenues totaled $2,430.2 million, representing 71.2% of net revenues in the quarter. On a year-over-year basis, the segment’s revenues grew 25.7% on the back of 12% gain from volume growth, 13% from acquired assets and 2% from currency movements. These positives were partially offset by 1% negative price impact.
Industrial generated revenues of $473.5 million, accounting for roughly 13.9% of net revenues in the quarter. Sales grew 4.3% year over year primarily driven 2% and 3% benefit from volume growth and favorable currency movements, respectively. These positives were partially offset by 1% adverse impact from divestitures.
Revenues from Security, roughly 14.9% of net revenues, decreased 4.3% year over year to $509.8 million. Favorable currency impact of 3%, volume gain of 2% and acquisition gains of 4% were more than offset by 13% negative impact of divestitures.
For 2017, the company’s revenues were approximately $12,747.2 million, beating the Zacks Consensus Estimate of $12.6 billion by roughly 1.2%. Also, the top line grew 11.7% year over year.
Gross Margin Slips on Higher Costs
In the quarter, Stanley Black & Decker’s cost of sales increased 17.2% year over year, accounting for 63.3% of quarter’s net sales versus 63.1% in the year-ago quarter. Gross margin slipped 20 basis points (bps) to 36.7% as divestiture impact and commodity inflation negated the positive impacts of volume growth and improved productivity.
Selling, general and administrative expenses increased 14.4% year over year while as a percentage of revenues, it decreased 50 bps to 22.9%.
Balance Sheet & Cash Flow
Exiting the fourth quarter, Stanley Black & Decker’s cash and cash equivalents were $637.5 million, up from $483.3 million in the previous quarter. Long-term debt (net of current portions) decreased 25.5% sequentially to $2,843 million.
In the fourth quarter, the company generated net cash of $950.8 million from its operating activities, increasing 13.8% year over year. Capital spending totaled $164.5 million versus $125.3 million in the year-ago quarter. Free cash flow improved to $786.3 million compared with $709.9 million in the year-ago quarter.
During the quarter, the company paid cash dividends of approximately $95 million and repurchased shares worth $12.5 million.
Outlook
For 2018, Stanley Black & Decker anticipates gaining from strengthening foothold in emerging markets, efforts to innovate products and growing recognition for brands — Craftsman, Lenox, Irwin and DeWalt FlexVolt. Also, the acquisition of Nelson Fastener Systems’ industrial business will be advantageous. This buyout, anticipated to be complete in the first half of 2018, will strengthen the company’s Engineered Fastening business and will be accretive to earnings per share.
The company anticipates adjusted earnings per share in the year to be within the $8.30-$8.50 range. Organic sales growth will be roughly 5%, adding 50-60 cents to earnings per share.
Commodity inflation of approximately $150 million will be partially offset by favorable pricing. The net impact of these will reduce earnings by 25-30 cents. Also, acquired assets, benefits from cost-savings actions and productivity enhancements, net of adverse impact of rise in share count, will add 45-50 cents to earnings. Tax rate of 18% will benefit earnings by 20 cents.
Free cash flow conversion is predicted to be roughly 100%.
Stanley Black & Decker, Inc. Price and Consensus
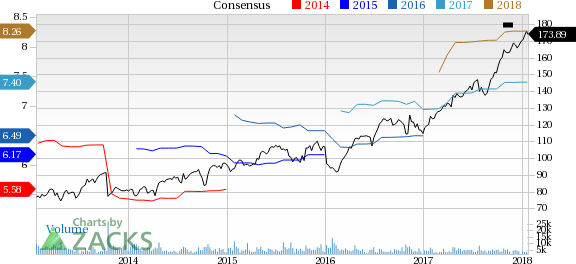
Stanley Black & Decker, Inc. Price and Consensus | Stanley Black & Decker, Inc. Quote
Zacks Rank & Key Picks
With a market capitalization of $26.7 billion, Stanley Black & Decker carries a Zacks Rank #3 (Hold). Some better-ranked stocks in the industry are Sandvik AB (OTC:SDVKY) , Kennametal Inc. (NYSE:KMT) and Lincoln Electric Holdings, Inc. (NASDAQ:LECO) . All these stocks carry a Zacks Rank #2 (Buy). You can see the complete list of today’s Zacks #1 (Strong Buy) Rank stocks here.
Sandvik’s earnings for 2018 have improved in the last 60 days. Also, its earnings in the next three to five years are anticipated to increase 7.5%.
Kennametal’s earnings for fiscal 2018 and fiscal 2019 have improved in the last 60 days. Also, the company delivered an average positive earnings surprise of 20.56% over the last four quarters.
Lincoln Electric Holdings pulled off an average positive earnings surprise of 3.65% over the last four quarters. Earnings for 2018 have improved in the last 60 days.
The Hottest Tech Mega-Trend of All
Last year, it generated $8 billion in global revenues. By 2020, it's predicted to blast through the roof to $47 billion. Famed investor Mark Cuban says it will produce "the world's first trillionaires," but that should still leave plenty of money for regular investors who make the right trades early.
See Zacks' 3 Best Stocks to Play This Trend >>
Palantir remains highly valued with a 460x P/E ratio and a 42.5x P/B ratio, far above its peers. The stock's beta of 2.81 signals high volatility, meaning sharp moves in both...
The S&P 500 had started to clear resistance, posting new all-time highs before sellers struck with a vengeance. The selling was bad, similar to that seen in December, which...
Myself and others have highlighted how European Equities have been breaking out to new all-time highs on the back of bullish factors such as cheap valuations, monetary tailwinds,...
Are you sure you want to block %USER_NAME%?
By doing so, you and %USER_NAME% will not be able to see any of each other's Investing.com's posts.
%USER_NAME% was successfully added to your Block List
Since you’ve just unblocked this person, you must wait 48 hours before renewing the block.
I feel that this comment is:
Thank You!
Your report has been sent to our moderators for review
Add a Comment
We encourage you to use comments to engage with other users, share your perspective and ask questions of authors and each other. However, in order to maintain the high level of discourse we’ve all come to value and expect, please keep the following criteria in mind:
Enrich the conversation, don’t trash it.
Stay focused and on track. Only post material that’s relevant to the topic being discussed.
Be respectful. Even negative opinions can be framed positively and diplomatically. Avoid profanity, slander or personal attacks directed at an author or another user. Racism, sexism and other forms of discrimination will not be tolerated.
Perpetrators of spam or abuse will be deleted from the site and prohibited from future registration at Investing.com’s discretion.