


Sign up to create alerts for Instruments,
Economic Events and content by followed authors
Free Sign Up Already have an account? Sign In
Please try another search

Last week’s review of the macro market indicators suggested, heading into the week that the equity markets were coming off of a good rebound higher but showed signs of exhaustion Friday. Elsewhere Gold (SPDR Gold Trust (ARCA:GLD)) looked to continue to pullback while Crude Oil (United States Oil Fund (NYSE:USO)) tried to move higher off of a bottom. The US Dollar Index (PowerShares db USD Index Bullish (NYSE:UUP)) might continue to consolidate the rise, pulling back mildly, while US Treasuries (iShares Barclays 20+ Year Treasury (ARCA:TLT)) were biased lower in their uptrend.
The Shanghai Composite (db X-trackers Harvest China (NYSE:ASHR)) looked to continue its pullback from a major run higher and Emerging Markets (iShares MSCI Emerging Markets (ARCA:EEM)) continued to consolidate in a bear flag in their downtrend. Volatility (iPath S&P 500 Vix Short Term Fut (ARCA:VXX)) looked to remain low but slowly rising slowing the wind behind equities to move higher. The equity index ETF’s SPDR S&P 500 (ARCA:SPY), iShares Russell 2000 Index (ARCA:IWM)and PowerShares QQQ (NASDAQ:QQQ), were all in a consolidation pattern in the intermediate term, despite the moves higher last week. The IWM looked the strongest and ready to test the all-time highs this week while the SPY was close behind but the QQQ a bit weaker.
The week played out with Gold continuing lower before a small bounce Friday while Crude Oil held another test of support in its bull flag. The US Dollar did continue the sideways consolidation while Treasuries continued down to new 6 week lows. The Shanghai Composite reversed back higher, in what could be a bear flag, while Emerging Markets looked messy in a tight range. Volatility made a new 2015 low as it neared a critical level. The Equity Index ETF’s saw this as good news, with the SPY and IWM making new all-time closing highs and the QQQ 14 year highs. What does this mean for the coming week? Lets look at some charts.
The SPY ended last week at the 50 day SMA with a Spinning Top doji, and Monday confirmed it higher. This also confirmed a break of the range since the start of the year. The rest of the week continued higher with Thursday a new all-time high close and followed up with another on Friday. The Bollinger Bands® have opened higher allowing the move to continue on the daily chart as the 20 day SMA turns up. The RSI on this timeframe is making a two month high as it continues into the bullish zone over 60. The MACD is also pointing higher.
Moving out to the weekly timeframe sees the strong candle piercing the consolidation zone that has held the SPY since late October. The RSI is making a marginally higher high and rising. It never left the bullish zone. The MACD is about to cross up, also supporting more upside price action. There is resistance (maybe) at the spike to 212.97 with a Measured Move to 224 above. Support lower may come at 209 and 206.40 followed by 204.30. Continued Upward Price Action.
SPY Weekly

Heading into a shortened February Options Expiration week the equity markets look strong, breaking long consolidations to the upside. Elsewhere look for Gold to lower in the short term in the longer consolidation while Crude Oil consolidates, and may be ready to reverse higher. The US Dollar Index looks to continue in a consolidation range while US Treasuries are biased lower.
The Shanghai Composite looks to continue to pullback in the uptrend and Emerging Markets look to hold in the bear flag, and might prove it a reversal higher. Volatility looks to remain subdued and now drifting lower, keeping the bias higher for the equity index ETF’s SPY, IWM and QQQ. Their charts all look strong on both the daily and weekly timeframes. If you had to pick a weakness then the gaps in the PowerShares QQQ (NASDAQ:QQQ) chart and move out of the Bollinger Bands® may signal short term exhaustion not seen in the S&P 500 and iShares Russell 2000 Index (ARCA:IWM). Use this information as you prepare for the coming week and trad’em well.
The information in this blog post represents my own opinions and does not contain a recommendation for any particular security or investment. I or my affiliates may hold positions or other interests in securities mentioned in the Blog, please see my Disclaimer page for my full disclaimer.
Tesla (NASDAQ:TSLA) (NYSE: TSLA), the electric vehicle giant, has recently experienced a significant drop in its stock value, which has fallen nearly 45% since December. This...
Through many years of frustration among gold bugs due to the failure of gold stock prices to leverage the gold prices in a positive way, there were very clear reasons for that...
I know there is the smell of fear in the air when I see my readership double as we reach a point where weekly chart factors come into play. Up until last week, markets have...
Are you sure you want to block %USER_NAME%?
By doing so, you and %USER_NAME% will not be able to see any of each other's Investing.com's posts.
%USER_NAME% was successfully added to your Block List
Since you’ve just unblocked this person, you must wait 48 hours before renewing the block.
I feel that this comment is:
Thank You!
Your report has been sent to our moderators for review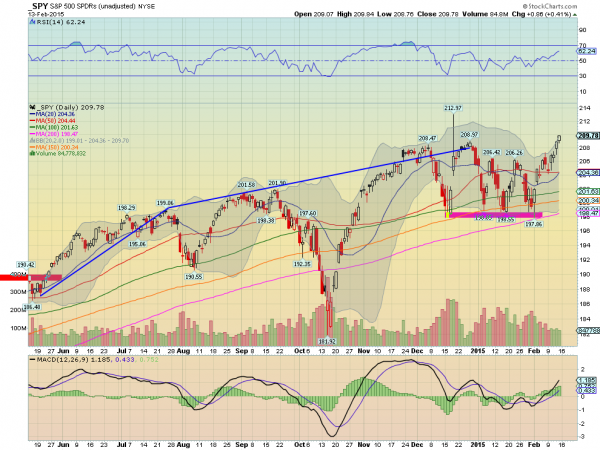

Add a Comment
We encourage you to use comments to engage with other users, share your perspective and ask questions of authors and each other. However, in order to maintain the high level of discourse we’ve all come to value and expect, please keep the following criteria in mind:
Enrich the conversation, don’t trash it.
Stay focused and on track. Only post material that’s relevant to the topic being discussed.
Be respectful. Even negative opinions can be framed positively and diplomatically. Avoid profanity, slander or personal attacks directed at an author or another user. Racism, sexism and other forms of discrimination will not be tolerated.
Perpetrators of spam or abuse will be deleted from the site and prohibited from future registration at Investing.com’s discretion.