


Sign up to create alerts for Instruments,
Economic Events and content by followed authors
Free Sign Up Already have an account? Sign In
Please try another search

It has been about a month since the last earnings report for Southwest Airlines Company (NYSE:LUV) . Shares have lost about 3.6% in that time frame, outperforming the DJIA.
Will the recent negative trend continue leading up to its next earnings release, or is LUV due for a breakout? Before we dive into how investors and analysts have reacted as of late, let's take a quick look at its most recent earnings report in order to get a better handle on the important catalysts.
Fourth Quarter Earnings
Southwest Airlines' earnings per share (excluding $2.41 from non-recurring items) of 77 cents beat the Zacks Consensus Estimate of 76 cents. The bottom line also increased 4.1% on a year-over-year basis.
Operating revenues of $5,274 million surpassed the Zacks Consensus Estimate of $5,242.1 million. Also, the top line improved 3.9% year over year. Passenger revenues accounted for bulk (89.8%) of the same.
Operating Statistics
Airline traffic, measured in revenue passenger miles, nudged up 2.6% year over year to 32.19 billion in the quarter under review. Capacity or available seat miles (ASMs) expanded 2% to 37.89 billion. Load factor (percentage of seats filled by passengers) came in at 85%, up 60 basis points on a year-over-year basis as traffic growth was more than capacity expansion.
Passenger revenue per available seat mile (PRASM: a key measure of unit revenues) inched up 0.5% to 12.50 cents. In the reported quarter, revenue per available seat mile (RASM), was 13.92 cents, up 1.9% year over year.
Operating Expenses & Income
In the fourth quarter, operating income (as reported) came in at $773 million compared with $846 million in the prior-year quarter. Excluding special items, the operating income stood at $746 million, down 2.9%. Total adjusted operating expenses (excluding profit sharing, fuel and oil expense plus special items) climbed 6.2% year over year.
Fuel price per gallon (inclusive of fuel tax: economic) increased 1% year over year to $2.09. Consolidated unit cost or cost per available seat mile (CASM) — excluding fuel, oil and special items — rose 4.1% year over year to 9.17 cents.
Liquidity
The company had cash and cash equivalents of $1,495 million at the end of the fourth quarter of 2017 compared with $1,680 million at the end of the comparable period in 2016. As of Dec 31, 2017, the company had a long-term debt (less current maturities) of $3,320 million compared with $2,821 million at the end of 2016.
While the carrier generated a cash flow of $1.8 billion at the end of 2017, it returned $1.9 billion to its shareholders through a combination of dividends and share repurchases.
Guidance
For the first quarter of 2018, the carrier expects revenue per available seat mile (RASM) to rise between 1% and 2%. First-quarter unit costs excluding fuel and oil expense, profit-sharing expense and special items are estimated to grow in the band of 0.5-1.5%. While economic fuel costs for the first quarter are predicted in the range of $2.10-$2.15 per gallon. For 2018, the metric is anticipated in the same range, reflecting an increase of 2% from the year-ago figure.
How Have Estimates Been Moving Since Then?
It turns out, fresh estimate flatlined during the past month. There has been one revision higher for the current quarter compared to one lower.
Southwest Airlines Company Price and Consensus
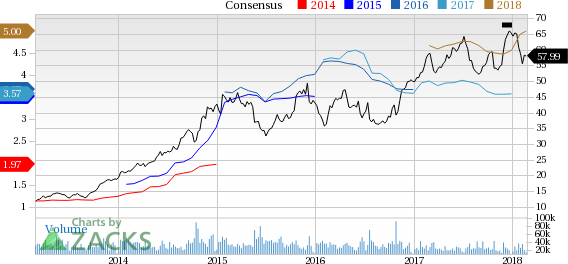
Southwest Airlines Company Price and Consensus | Southwest Airlines Company Quote
VGM Scores
At this time, LUV has a nice Growth Score of B, a grade with the same score on the momentum front. The stock was also allocated a grade of B on the value side, putting it in the second quintile for this investment strategy.
Overall, the stock has an aggregate VGM Score of A. If you aren't focused on one strategy, this score is the one you should be interested in.
Based on our scores, the stock is equally suitable for momentum, value and growth investors.
Outlook
LUV has a Zacks Rank #2 (Buy). We expect an above average return from the stock in the next few months.
Palantir remains highly valued with a 460x P/E ratio and a 42.5x P/B ratio, far above its peers. The stock's beta of 2.81 signals high volatility, meaning sharp moves in both...
The S&P 500 had started to clear resistance, posting new all-time highs before sellers struck with a vengeance. The selling was bad, similar to that seen in December, which...
Myself and others have highlighted how European Equities have been breaking out to new all-time highs on the back of bullish factors such as cheap valuations, monetary tailwinds,...
Are you sure you want to block %USER_NAME%?
By doing so, you and %USER_NAME% will not be able to see any of each other's Investing.com's posts.
%USER_NAME% was successfully added to your Block List
Since you’ve just unblocked this person, you must wait 48 hours before renewing the block.
I feel that this comment is:
Thank You!
Your report has been sent to our moderators for review
Add a Comment
We encourage you to use comments to engage with other users, share your perspective and ask questions of authors and each other. However, in order to maintain the high level of discourse we’ve all come to value and expect, please keep the following criteria in mind:
Enrich the conversation, don’t trash it.
Stay focused and on track. Only post material that’s relevant to the topic being discussed.
Be respectful. Even negative opinions can be framed positively and diplomatically. Avoid profanity, slander or personal attacks directed at an author or another user. Racism, sexism and other forms of discrimination will not be tolerated.
Perpetrators of spam or abuse will be deleted from the site and prohibited from future registration at Investing.com’s discretion.