


Sign up to create alerts for Instruments,
Economic Events and content by followed authors
Free Sign Up Already have an account? Sign In
Please try another search

Silver will have initially taken off to correct its historic low in the metal’s ratio to gold, as part of a rotational drive toward value (see gold:silver ratio below). Later, multi-dollar moves will be discounting legislation prohibiting the public’s gold ownership.
The drivers cited above will have served the purpose for attaining the long-since-discussed levels at $20, 50 (1980 peak), ~125 (inflation-adjusted all-time high), and 500, which will coincide with an inflation-adjusted price in the thousands for gold.
This year, the relationship between silver’s volatility index versus the metal might not normalize until silver hits the $21-24 area (see VXSLV chart below). Of course, this is a major consideration with respect to any and all option strategies.
In sum, understanding silver’s movements and how to profit in the short and long term requires analysis of (a) its relationship to its option premium volatility indicator and, (b) silver’s relationship to gold. Hence, for critical context, please note the excerpts and charts that follow. (This paragraph’s linked article explained the importance and forecast, of a reversion to the previous asymmetry that had existed between the VIX and the VXSLV.)
“The 3-month VXSLV chart below includes its 5-wave explosion to new all-time highs at 110.
“After breaking the 2011 high (when the SLV had hit a price just under $50), I identified the top based on the fact that it was being influenced by the VIX and the COVID-driven fear that was dragging that index higher.
“I viewed the VXSLV rally as unsustainable, as I believed that the SLV and VXSLV’s future long term trends to be co-directional and NOT asymmetric.”
“I have almost no doubt, however, that the relationship between the SLV and the VXSLV has reverted. Despite the law of diminishing returns, volatility premiums spiked when silver declined after the 2011 peak.
“Today, the market must be deeply concerned about the unlimited upside potential that a bull market presents for this low priced asset.”
Given the decline from 110 and the fact that I look for an eruption in silver and, further, since my analysis is that silver and its option premiums will have ultimately trended co-directionally, I advise entering into a bullish option strategy (see Strategy section at bottom), paying no mind to the fact that the VXSLV remains at a lofty level, historically-speaking, despite the collapse from its all-time high at 110.
A more proper relationship between silver and its option premiums will likely not come back until silver trades at somewhat higher levels than the abnormally low price at which it presently changes hands. This is because the option market is treating today’s prices as an aberration resulting from the first quarter’s market debacle.
Silver ETF Volatility Index
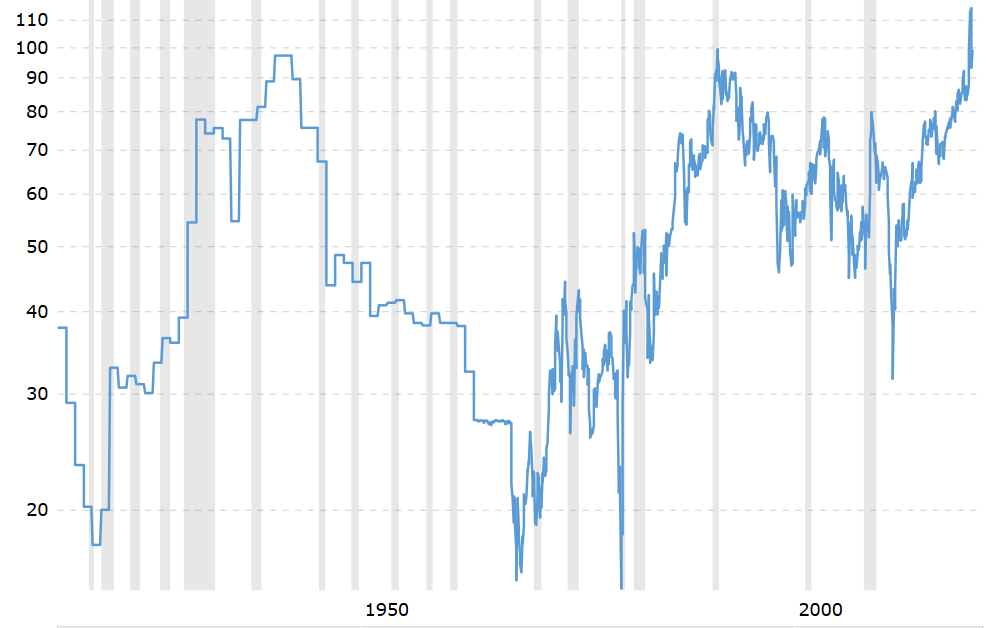
Today’s last technical analysis is of the 100-year gold:silver ratio chart, below.
“Importantly, note that the new and unsustainable all-time high in the gold:silver ratio has, in all likelihood, reversed. The ratio hit 120, after breaking the previous peak of 100, a level that was previously challenged only twice over the past 100 years (see March 19, 2020 pre-open report).”
Gold Silver Ratio Chart
One should hold silver forever, and that view has not changed. For those who seek to add speculative leverage:
Trend-channel and price support both exist around $15 (SLV chart not shown). Moreover, 15 represents a correction of ~ 50% from the orthodox Elliott low at $13 and the recent peak just under $17.
All taken together, including the critical technical views above regarding the VXSLV, a quick smack in the latter to the low 30’s, which should coincide with a sharp and fast decline to a pre-July 4 low around $15.25 in the SLV, could be used to jump on the September 31, 2020 17-strike calls.
Originally published June 16
Gold is feeling a bit of pressure at the start of the week as markets are cautious of what lies ahead. Rising tariff developments, recessionary fears and an uncertain geopolitical...
Treasury Secretary Scott Bessent said no one gave him credit or the administration credit for falling oil prices or lower interest rates. What that means is that Scott Bessent has...
Gold stays near highs with $3K within reach. US inflation data could fuel the next gold rally. Key levels: Support at $2900, resistance at $2950-$3K. Get the AI-powered list of...
Are you sure you want to block %USER_NAME%?
By doing so, you and %USER_NAME% will not be able to see any of each other's Investing.com's posts.
%USER_NAME% was successfully added to your Block List
Since you’ve just unblocked this person, you must wait 48 hours before renewing the block.
I feel that this comment is:
Thank You!
Your report has been sent to our moderators for review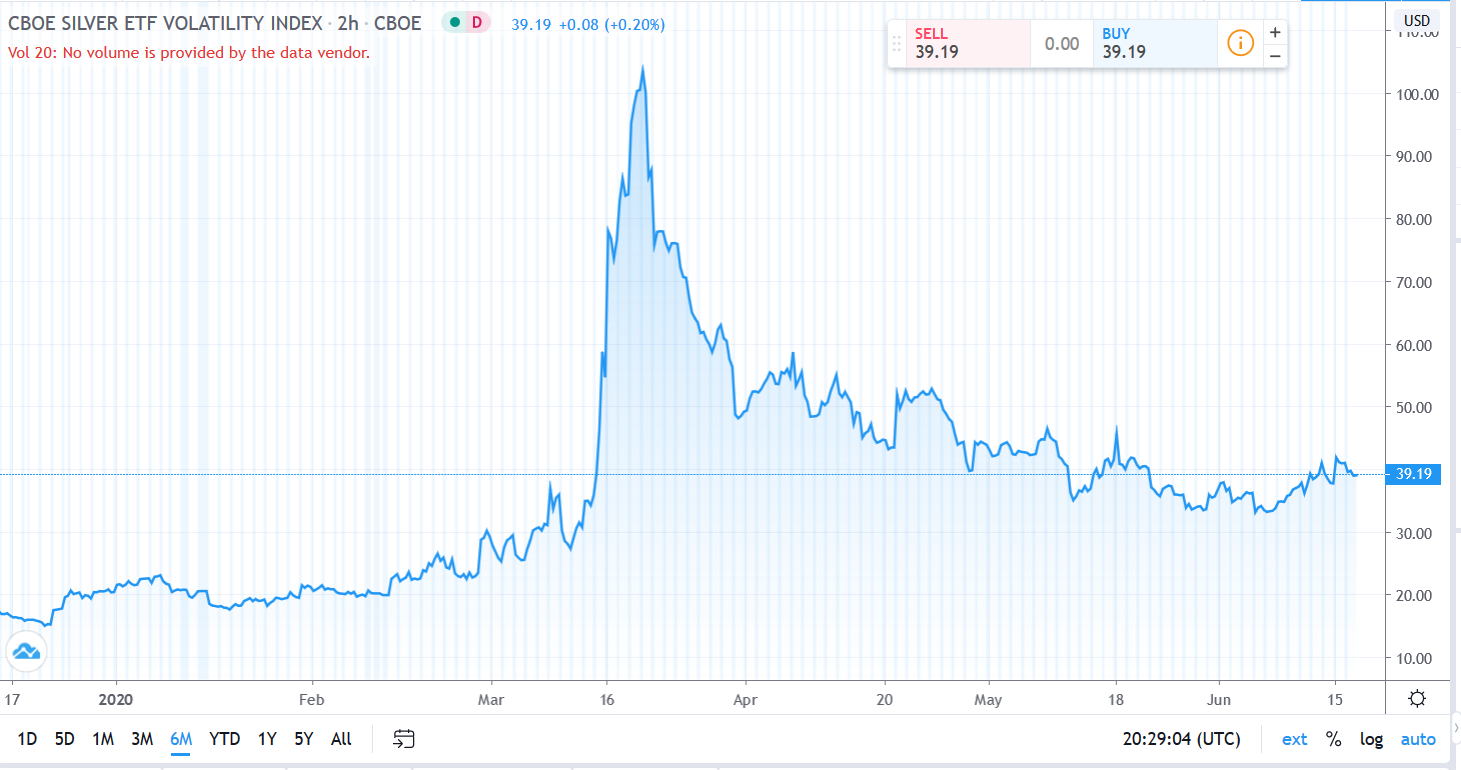

Add a Comment
We encourage you to use comments to engage with other users, share your perspective and ask questions of authors and each other. However, in order to maintain the high level of discourse we’ve all come to value and expect, please keep the following criteria in mind:
Enrich the conversation, don’t trash it.
Stay focused and on track. Only post material that’s relevant to the topic being discussed.
Be respectful. Even negative opinions can be framed positively and diplomatically. Avoid profanity, slander or personal attacks directed at an author or another user. Racism, sexism and other forms of discrimination will not be tolerated.
Perpetrators of spam or abuse will be deleted from the site and prohibited from future registration at Investing.com’s discretion.