Everything points to another hard smash down for stocks, with the main question being whether or not the following weeks will include a new low, or a higher one that is accompanied by momentum and/or VIX divergences. To examine this question, today’s report follows-up on prior Dow and precious metals analyses, supported by their technical studies.
DOW
Weeks ago, Donald Trump said that the COVID crisis would be largely over by August. The speechwriters should be viewed as insiders. The stock market has a built-in 3-month (or more) discounting mechanism, I have found.
Meanwhile, the technical analyses below support a collapse to the 15,700 target. In making that new low, the market would perhaps be discounting the next 12-months’ COVID-affected earnings. Hence, the 3-month discounting mechanism, since August would presumably mark the darkest hour resulting from COVID-driven economic calamity.
Insiders, however, already know that the treatment is out there and, typical of a pattern that includes such a lofty wave-4 50% retracement such as what we are presently seeing, the coming decline could perhaps only bring a proximate double-bottom that would include only a very minor new low, coupled with momentum and/or VIX divergences.
Either way, technically, the risk over the coming 2 weeks is plainly to the downside.
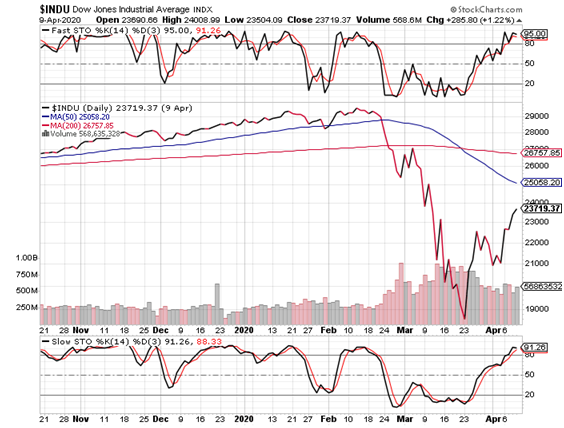
The Dow chart immediately below shows that (a) it has rallied 50% from the bottom, (b) the fast and slow stochastic are overbought and pointing down (they appear above and below the price chart, respectively), (c) wave-4 is presently a perfect a-b-c, and (d) each of the 4 waves from the top has lasted ~ 2.5 weeks, except for wave-2 which only took about a week.
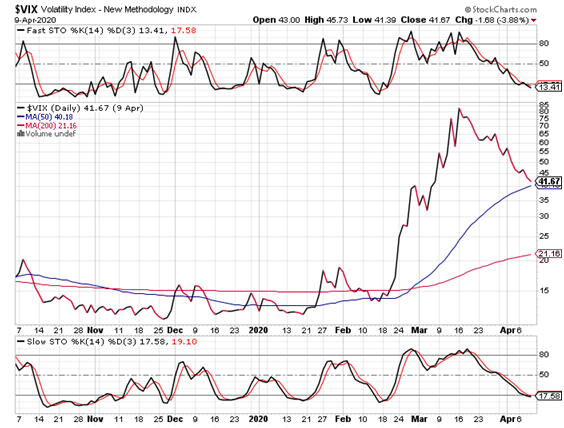
Rather understandably, the following VIX chart illustrates the mirror image of the Dow picture above. Importantly, however, it is possible that a 5-wave advance up completed and that any new Dow decline could potentially be coupled with a VIX non-confirmation. As we know, option premiums often lead since they tend to represent peak momentum for the move, whether up or down.
Either way, it is safer than usual to have bear startegies on, if only for a couple of weeks. Then, be ready to reassess….and take NOTHING for granted.
The 2019 yearend target of a decline of 10,000 Dow points in 2020 has already been achieved and, with VIX levels so historically high, short sellers are at great risk.
Still, risk premiums are wihin a new papradigm for now and over the coming 2 weeks. Yet, it only takes a single bit of news (regarding the treatment for COVID) to materially deflate these stock and precious metals’ option time premiums.
SILVER
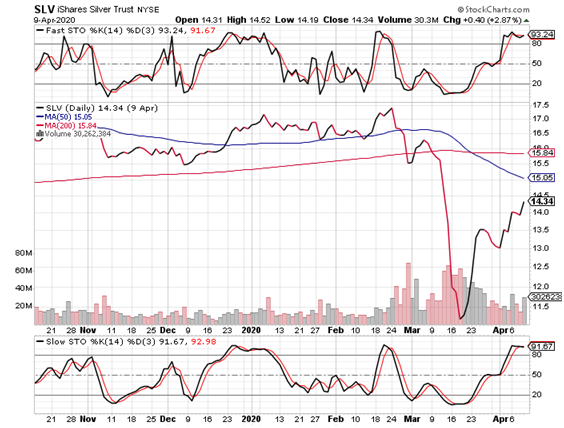
The SLV chart immediately below shows that (a) it has rallied 50% from the bottom, (b) the fast and slow stochastic are overbought and rolling over (they appear above and below the price chart, respectively), (c) wave-4 within a larger a-b-c is presently a perfect a-b-c, and (d) each wave from the top has so far taken ~ 2.5 weeks, except for wave-2 which was only about a week.
The paragraph above is nearly identical to the one which immediately precedes the Dow chart in the first section above. As compared to the Dow, however, the SLV would very likely only make a higher low.
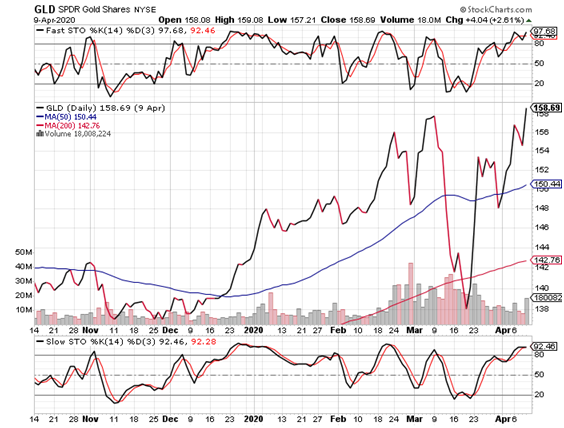
As regards the GLD chart which follows, the single-most critical observation remains that corrections continue to occur within an uptrend. This underscores the incredible power of this bull market.
While identifying this year’s extremes, I reiterated the analysis that each move to its high or low was part of a corrective uptrend. One’s investment planning is greatly enhanced by understanding this phenomenon.
From the December 2, 20-19 report:
"Consistent with the above, the relative power in gold is masking its true wave count, as corrections actually occur within up-moves.”
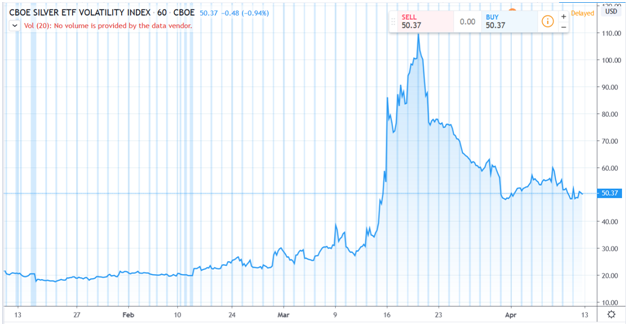
The 3-month VXSLV chart below includes its 5-wave explosion to new all-time highs at 110.
After breaking the 2011 high (when the SLV had hit a price just under $50), I identified the top based on the fact that it was being influenced by the VIX and the COVID-driven fear that was dragging that index higher.
I viewed the VXSLV rally as unsustainable, as I believed that the SLV and VXSLV’s future long term trends to be co-directional and NOT asymmetric.
From the April 6, 2020 report:
“I have almost no doubt, however, that the relationship between the SLV and the VXSLV has reverted. Despite the law of diminishing returns, volatility premiums spiked when silver declined after the 2011 peak.
“Today, the market must be deeply concerned about the unlimited upside potential that a bull market presents for this low priced asset.”
Trend-channel support for the VXSLV is ~ 40 over the coming month.
Given the decline from 110 and the fact that I look for an explosion in silver this year and, further, since my analysis is that silver and its option premiums will trend co-directionally, I will likely advise entering into a bullish option strategy this quarter, paying no mind to the fact that 40 would still be at a lofty level, historically-speaking.
A more proper relationship between silver and its option premiums will likely not come back until silver trades at somewhat higher levels than the abnormally low price at which it presently changes hands.
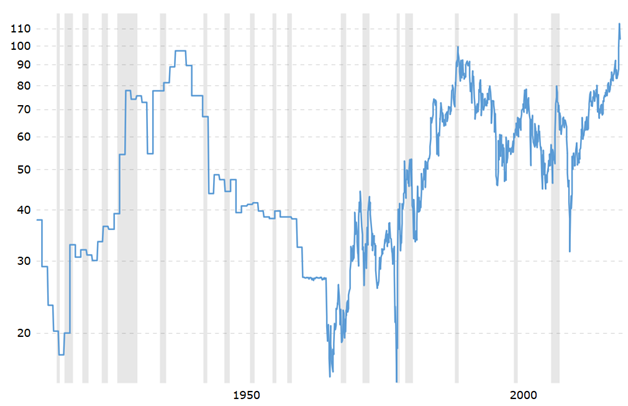
Once again, today’s last technical analysis is of the 100-year gold:silver ratio chart.
From the April 6, 2020 report.
“Importantly, note that the new and unsustainable all-time high in the gold:silver ratio has, in all likelihood, reversed. The ratio hit 120, after breaking the previous peak of 100, a level that was previously challenged only twice over the past 100 years (see March 19, 2020 pre-open report).”
The recent new all-time-high in the gold:silver ratio only slightly eclipsed its previous ATH, just as the relationship’s price had done versus the first of its three all-time highs in the 100-area over the past 100 years (see chart below).
NB: If gold’s corrections are occurring within an uptrend, then the true power of gold’s bull market is truly being masked in extreme fashion, as I write above, since one must now also consider the gold:silver ratio and its related comments immediately above.
It is simple math.
If gold’s corrections are occurring within up-trends, and if the gold:silver ratio has peaked and begun a new bear market from its nosebleed levels, then the conclusion must follow that a 2020 eruption in silver may now ensue. This could fulfill the 2019 yearend forecast that had called for a top-to-bottom Dow decline of 10,000 points that would be coupled with a bottom-to-top $10 rally in silver, from the 2019 extremes in these two markets.
This suggests more fireworks to come in 2020.
This report was written on April 12, 2020.
