
Shares of Signature Bank’s (NASDAQ:SBNY) have gained about 8% following the release of fourth-quarter 2018 results. Earnings per share of $2.94 surpassed the Zacks Consensus Estimate of $2.79. Further, the bottom line compares favorably with $2.11 earned in the prior-year quarter.
Results reflected overall growth in revenues. In addition, loan and deposit balances displayed continued improvement. Moreover, lower provisions acted as tailwinds. However, rise in expenses was a drag.
Net income for the fourth quarter was $160.8 million compared with $114.9 million recorded in the year-ago quarter.
For full-year 2018, earnings per share were $9.23 per share, surpassing the Zacks Consensus Estimate of $9.10. Further, the figure compares favorably with $7.12 per share earned in the prior year.
Rise in Revenues Partially Offset by Higher Expenses
For full-year 2018, the company reported revenues of $1.32 billion, up around 3.8% year over year. Moreover, the revenue figure surpassed the Zacks Consensus Estimate of $1.31 billion.
Signature Bank’s total revenues in the quarter rose 3.9% from the prior-year quarter to $341 million. Also, the top line surpassed the Zacks Consensus Estimate of $331.5 million.
Net interest income increased 4.8% year over year to $335 million backed by rise in average interest earning assets. However, net interest margin contracted 17 basis points to 2.90%.
Non-interest income was $5.9 million, down nearly 30.3% year over year. The decline was primarily on account of an increase in tax credit investment amortization.
Non-interest expenses of $119.2 million were up 8.4% from the prior-year quarter. The rise was primarily a result of the addition of private client banking teams, and an increase in costs in risk management and compliance-related activities.
Efficiency ratio was 34.94% compared with 33.50% reported as of Dec 31, 2017. Higher ratio indicates fall in profitability.
The company’s loans and leases, net as of Dec 31, 2018, were $36.2 billion, up 11.7% from Dec 31, 2017. Further, total deposits rose 8.8% from 2017 end to $36.4 billion.
Credit Quality: A Mixed Bag
The company recorded net recoveries of $2.9 million in the quarter against net-charge offs of $38.8 million in the prior-year quarter. In addition, provision for loan and lease losses declined 84.6% to $6.4 million.
However, the allowance for loan losses represented 0.63% of total loans as of Dec 31, 2018, compared with 0.60% as of Dec 31, 2017.
Capital Ratios
As of Dec 31, 2018, Tier 1 risk-based capital ratio was 12.09% compared with 11.99% as of Dec 31, 2017. Further, total risk-based capital ratio was 13.39% compared with 13.32% in the prior-year quarter. Tangible common equity ratio was 9.21%, down from 9.29% as of Dec 31, 2017.
Return on average assets was 1.37% in the reported quarter compared with 1.08% in the prior-year quarter. As of Dec 31, 2018, return on average common stockholders' equity was 14.76%, up from 11.44% as of Dec 31, 2017.
Our Viewpoint
Signature Bank’s fourth-quarter results reflect solid capital position and robust balance sheet. The company remains focused on investing in technology by enhancing payments platform and credit approval system. However, rising interest rates continue to impact net interest margin due to its liability sensitive balance sheet, and remains a major concern.
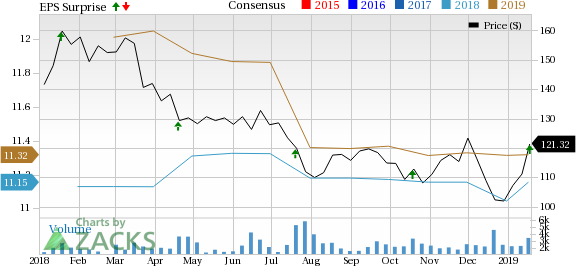
Signature Bank Price, Consensus and EPS Surprise
Currently, Signature Bank carries a Zacks Rank #3 (Hold). You can see the complete list of today’s Zacks #1 Rank (Strong Buy) stocks here.
Performance of Other Banks
KeyCorp’s (NYSE:KEY) fourth-quarter 2018 adjusted earnings of 48 cents per share surpassed the Zacks Consensus Estimate by a penny. Also, the figure compared favorably with earnings of 36 cents recorded in the prior-year quarter.
Reflecting the highest net revenues since 2010, Goldman Sachs’ (NYSE:GS) fourth-quarter 2018 results recorded a positive earnings surprise of 23.8%. The company reported earnings per share of $6.04, comfortably beating the Zacks Consensus Estimate of $4.88. The bottom line also compares favorably with adjusted earnings of $5.68 per share recorded in the year-earlier quarter.
Comerica’s (NYSE:CMA) fourth-quarter 2018 earnings per share of $1.88 surpassed the Zacks Consensus Estimate of $1.86. Also, the results compared favorably with year-ago adjusted figure of $1.24.
Looking for Stocks with Skyrocketing Upside?
Zacks has just released a Special Report on the booming investment opportunities of legal marijuana.
Ignited by new referendums and legislation, this industry is expected to blast from an already robust $6.7 billion to $20.2 billion in 2021. Early investors stand to make a killing, but you have to be ready to act and know just where to look.
See the pot trades we're targeting>>
KeyCorp (KEY): Get Free Report
Comerica Incorporated (CMA): Get Free Report
Signature Bank (SBNY): Free Stock Analysis Report
The Goldman Sachs Group, Inc. (GS): Get Free Report
Original post