


Sign up to create alerts for Instruments,
Economic Events and content by followed authors
Free Sign Up Already have an account? Sign In
Please try another search

Value investing is easily one of the most popular ways to find great stocks in any market environment. After all, who wouldn’t want to find stocks that are either flying under the radar and are compelling buys, or offer up tantalizing discounts when compared to fair value?
One way to find these companies is by looking at several key metrics and financial ratios, many of which are crucial in the value stock selection process. Let’s put Tech Data Corporation (NASDAQ:TECD) stock into this equation and find out if it is a good choice for value-oriented investors right now, or if investors subscribing to this methodology should look elsewhere for top picks:
PE Ratio
A key metric that value investors always look at is the Price to Earnings Ratio, or PE for short. This shows us how much investors are willing to pay for each dollar of earnings in a given stock, and is easily one of the most popular financial ratios in the world. The best use of the PE ratio is to compare the stock’s current PE ratio with: a) where this ratio has been in the past; b) how it compares to the average for the industry/sector; and c) how it compares to the market as a whole.
On this front, Tech Data has a trailing twelve months PE ratio of 9.7, as you can see in the chart below:
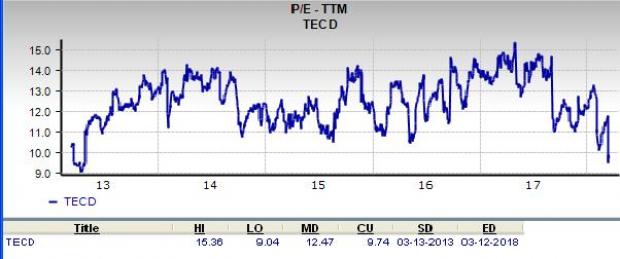
This level actually compares pretty favorably with the market at large, as the PE for the S&P 500 stands at about 21.6. If we focus on the long-term PE trend, Tech Data’s current PE level puts it below its midpoint over the past five years.

Further, the stock’s PE also compares favorably with the Zacks Retail - Computer Hardware industry’s trailing twelve months PE ratio, which stands at 11.7. At the very least, this indicates that the stock is relatively undervalued right now, compared to its peers.
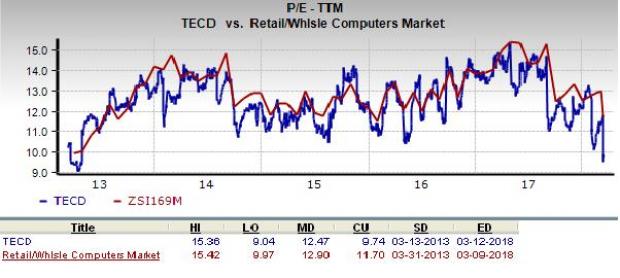
We should also point out that Tech Data has a forward PE ratio (price relative to this year’s earnings) of just 8.4, so it is fair to say that a slightly more value-oriented path may be ahead for Tech Data stock in the near term too.
P/S Ratio
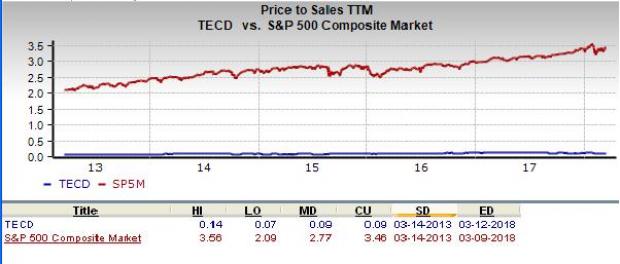
Another key metric to note is the Price/Sales ratio. This approach compares a given stock’s price to its total sales, where a lower reading is generally considered better. Some people like this metric more than other value-focused ones because it looks at sales, something that is far harder to manipulate with accounting tricks than earnings.
Right now, Tech Data has a P/S ratio of about 0.1. This is a bit lower than the S&P 500 average, which comes in at 3.5x right now. Also, as we can see in the chart below, this is well below the highs for this stock in particular over the past few years, suggesting some level of undervalued trading—at least compared to historical norms.
Broad Value Outlook
In aggregate, Tech Data currently has a Value Score of A, putting it into the top 20% of all stocks we cover from this look. This makes Tech Data a solid choice for value investors, and some of its other key metrics make this pretty clear too.
For example, the PEG ratio for Tech Data is just 0.4, a level that is far lower than the industry average of 0.9. The PEG ratio is a modified PE ratio that takes into account the stock’s earnings growth rate. Clearly, TECD is a solid choice on the value front from multiple angles.
What About the Stock Overall?
Though Tech Data might be a good choice for value investors, there are plenty of other factors to consider before investing in this name. In particular, it is worth noting that the company has a Growth Score of A and a Momentum Score of A This gives TECD a Zacks VGM score — or its overarching fundamental grade — of A. (You can read more about the Zacks Style Scores here >>)
Meanwhile, the company’s recent earnings estimates have been mixed at its best. The current quarter has seen one estimate to go higher in the past sixty days compared to one lower, while the full year estimate has seen three up and one down in the same time period.
This has had a significant impact on the consensus estimate though as the current quarter consensus estimate has fallen by 2.6% in the past two months, while the full year estimate has gone up by 1.8%. You can see the consensus estimate trend and recent price action for the stock in the chart below:
Tech Data Corporation Price and Consensus
This somewhat mixed trend is why the stock has just a Zacks Rank #3 (Hold) and why we are looking for in-line performance from the company in the near term.
Bottom Line
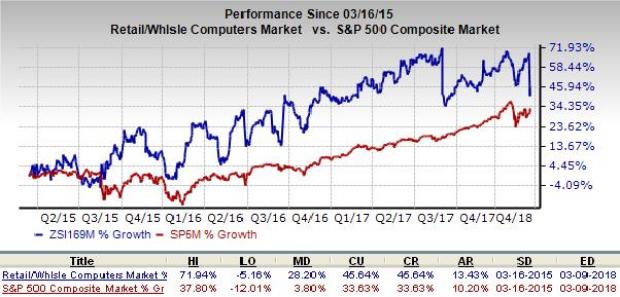
Tech Data is an inspired choice for value investors, as it is hard to beat its incredible lineup of statistics on this front. Moreover, a strong industry rank (Top 14% out of more than 250 industries) further strengthens its growth potential. In fact, over the past three years, the industry has clearly outperformed the broader market, as you can see below:
So, value investors might want to wait for estimates and analyst sentiment to turn around in this name first, but once that happens, this stock could be a compelling pick.
Zacks Top 10 Stocks for 2018
In addition to the stocks discussed above, would you like to know about our 10 finest buy-and-hold tickers for the entirety of 2018?
Last year's 2017 Zacks Top 10 Stocks portfolio produced double-digit winners, including FMC Corp (NYSE:FMC). and VMware which racked up stellar gains of +67.9% and +61%. Now a brand-new portfolio has been handpicked from over 4,000 companies covered by the Zacks Rank. Don’t miss your chance to get in on these long-term buys.
Access Zacks Top 10 Stocks for 2018 today >>
The fortune of Nvidia (NASDAQ:NVDA) is closely tied to Big Tech hyperscalers. Although the AI/GPU designer didn’t name its largest clients in the latest 10-K filing on Wednesday,...
In a market fraught with uncertainty, investors often seek refuge in defensive-minded stocks that offer stability and resilience. Two such stalwarts, Johnson & Johnson and...
The United States is the largest exporter of liquefied natural gas (LNG), having surpassed Australia and Qatar in 2023. The United States exports an estimated 12.5 billion cubic...
Are you sure you want to block %USER_NAME%?
By doing so, you and %USER_NAME% will not be able to see any of each other's Investing.com's posts.
%USER_NAME% was successfully added to your Block List
Since you’ve just unblocked this person, you must wait 48 hours before renewing the block.
I feel that this comment is:
Thank You!
Your report has been sent to our moderators for review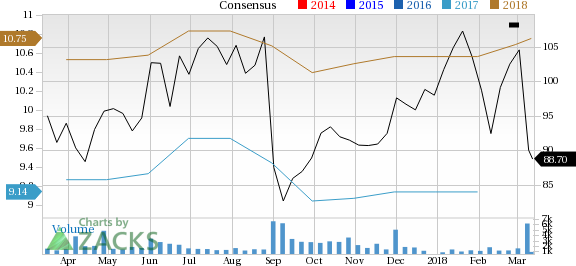

Add a Comment
We encourage you to use comments to engage with other users, share your perspective and ask questions of authors and each other. However, in order to maintain the high level of discourse we’ve all come to value and expect, please keep the following criteria in mind:
Enrich the conversation, don’t trash it.
Stay focused and on track. Only post material that’s relevant to the topic being discussed.
Be respectful. Even negative opinions can be framed positively and diplomatically. Avoid profanity, slander or personal attacks directed at an author or another user. Racism, sexism and other forms of discrimination will not be tolerated.
Perpetrators of spam or abuse will be deleted from the site and prohibited from future registration at Investing.com’s discretion.