


Sign up to create alerts for Instruments,
Economic Events and content by followed authors
Free Sign Up Already have an account? Sign In
Please try another search

Semtech Corporation (NASDAQ:SMTC) reported mixed fiscal third-quarter 2018 results with earnings beating the Zacks Consensus Estimate but revenues missing the same.
Non-GAAP earnings of 54 cents per share beat the consensus mark by 5 cents and increased 12.5% sequentially and a massive 45.9% year over year. Earnings came ahead of the guided range of 48–52 cents per share.
Revenues of $150 million missed the consensus mark by $3 million and decreased 1.8% sequentially. However, revenues increased 9.6% year over year. Revenues were toward the higher end of the guided range of $145.0 million to $153.0 million.
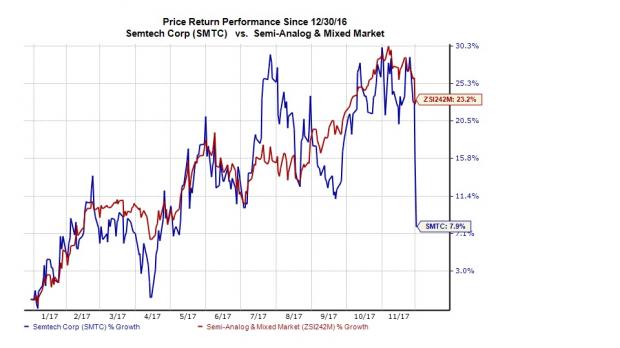
Nevertheless, shares have lost 6.8% since the date of release of quarterly results due to an unimpressive guidance for the current quarter. Year to date, shares have gained 7.9%, significantly underperforming the industry’s 23.2% rally.
In the reported quarter, the company saw strong demand for high-end consumer and industrial end-markets, partially offset by weakness in enterprise computing and communications markets.
The company’s improved profitability was driven by differentiated growth drivers and diversification strategy. Key growth drivers for Semtech are product differentiation, operational flexibility and a specific focus on fast-growing segments and regions.
The numbers in detail:
Revenues by End Market
Sales to high-end consumer market represented 30% of total net revenues and were up sequentially. Roughly 23% of high-end consumer revenues were attributable to mobile devices, and 7% to other consumer systems.
Sales to industrial market represented 28% of total revenues and were up sequentially. Enterprise computing and communications end markets witnessed weak demand and both decreased sequentially, representing 31% and 11% of total revenues, respectively.
Revenues by Product Group
Signal Integrity Product Group revenues contributed 41% to total revenues and were down sequentially but up 6% year over year. While the sequential decline was due to weak passive optical network (PON) and base station business resulting from demand softness in China, the year-over-year growth was driven by strength in data center business.
Protection Product Group represented 32% of total revenues and was up 10% sequentially and 23% year over year. The increase was driven by smartphone strength in North America and Korea offset by softness in China’s smartphone market.
Wireless and Sensing Product Group was down sequentially but up 29% year over year, contributing 20% to total revenues. The year-over-year increase was driven by strength in LoRa related business, partially offset by weakness in proximity sensing business.
Power and High-Reliability Product Group contributed 8% to total revenues and increased 7% sequentially. The increase was due to increased designing activity in the automotive and industrial markets.
Distribution sales represented approximately 66% of total revenues, while direct sales accounted for the remaining 34%.
Semtech Corporation Revenue (TTM)
Bookings
During the quarter, bookings increased sequentially, accounting for roughly 50% of shipments. Book-to-bill ratio was roughly 1.
Margins and Net Income
Non-GAAP gross margin was 61.3%, up 10 basis points (bps) sequentially and 90 bps year over year due to the impact of lower inventory adjustments offset by less favorable product mix.
Semtech’s operating expenses (selling, general and administrative [SG&A] plus product development and engineering) of $53.2 million increased slightly sequentially and 2.5% year over year. As a percentage of sales, both SG&A and product development & engineering expenses decreased year over year.
The net result was an operating margin of 27.4% that was flat sequentially but increased 380 bps year over year.
On a non-GAAP basis, Semtech recorded net income of $36.5 million compared with $24.4 million a year ago. On a GAAP basis, the company recorded net income of $13.3 million or 20 cents per share compared with $30.8 million or 46 cents per share a year ago.
Balance Sheet & Cash Flow
Semtech ended the quarter with cash and cash equivalents of $291.1 million, up from $277.9 million in the previous quarter. Accounts receivables were $66.5 million, up from $61.2 million in the prior quarter. Long-term debt was $215.7 million, down from $219.3 million in the previous quarter.
During the quarter, cash flow from operations was $26.9 million, capital expenditure was $7.9 million and free cash flow totaled $19 million.
Guidance
For fiscal fourth quarter 2018, on a non-GAAP basis, management expects revenues in the range of $138 million to $142 million. This implies 7.1% sequential decline at the mid-point of the guided range. The Zacks Consensus Estimate is pegged at $151.0 million.
Non-GAAP gross profit margin is expected within 61.0%-62.0%. Management projects SG&A expense within $26-$27 million, and research and development expense of $23-$24 million.
Non-GAAP earnings per share are expected in the range of 40–42 cents. This implies a massive 31.7% sequential decline at the mid-point of the guided range. The Zacks Consensus Estimate is pegged at 47 cents.
Zacks Rank and Stocks to Consider
Semtech has a Zacks Rank #3 (Hold). You can see the complete list of today’s Zacks #1 Rank (Strong Buy) stocks here.
Better-ranked stocks in the broader technology sector include Activision Blizzard (NASDAQ:ATVI) , Twitter (NYSE:TWTR) and Five9 (NASDAQ:FIVN) , each carrying a Zacks Rank #2 (Buy).
Long-term earnings per share growth rate for Activision, Twitter and Alibaba (NYSE:BABA) is projected to be 13.8%, 21.5% and 20%, respectively.
5 Medical Stocks to Buy Now
Zacks names 5 companies poised to ride a medical breakthrough that is targeting cures for leukemia, AIDS, muscular dystrophy, hemophilia, and other conditions.
New products in this field are already generating substantial revenue and even more wondrous treatments are in the pipeline. Early investors could realize exceptional profits.
Click here to see the 5 stocks >>
The fortune of Nvidia (NASDAQ:NVDA) is closely tied to Big Tech hyperscalers. Although the AI/GPU designer didn’t name its largest clients in the latest 10-K filing on Wednesday,...
Home improvement retailers Lowe’s (NYSE:LOW) and Home Depot (NYSE:HD) turned a corner, and their Q4 2024 earnings reports confirmed it. The corner is a return to comparable store...
One of our old flames, a former Contrarian Income Portfolio holding, has pulled back sharply in recent weeks. Time to buy the dip in this 4.3% dividend? Let’s discuss. Kinder...
Are you sure you want to block %USER_NAME%?
By doing so, you and %USER_NAME% will not be able to see any of each other's Investing.com's posts.
%USER_NAME% was successfully added to your Block List
Since you’ve just unblocked this person, you must wait 48 hours before renewing the block.
I feel that this comment is:
Thank You!
Your report has been sent to our moderators for review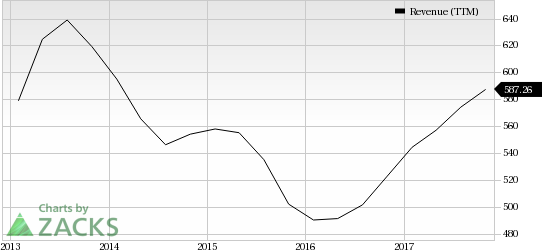

Add a Comment
We encourage you to use comments to engage with other users, share your perspective and ask questions of authors and each other. However, in order to maintain the high level of discourse we’ve all come to value and expect, please keep the following criteria in mind:
Enrich the conversation, don’t trash it.
Stay focused and on track. Only post material that’s relevant to the topic being discussed.
Be respectful. Even negative opinions can be framed positively and diplomatically. Avoid profanity, slander or personal attacks directed at an author or another user. Racism, sexism and other forms of discrimination will not be tolerated.
Perpetrators of spam or abuse will be deleted from the site and prohibited from future registration at Investing.com’s discretion.