


Sign up to create alerts for Instruments,
Economic Events and content by followed authors
Free Sign Up Already have an account? Sign In
Please try another search

About a month has gone by since the last earnings report for Salesforce.com Inc (NYSE:CRM) . Shares have lost about 4.7% in that time frame, underperforming the market.
Will the recent negative trend continue leading up to the stock's next earnings release, or is it due for a breakout? Before we dive into how investors and analysts have reacted as of late, let's take a quick look at the most recent earnings report in order to get a better handle on the important catalysts.
Recent Earnings
Continuing its earnings streak for the seventh quarter in a row, Salesforce posted splendid third-quarter fiscal 2018 results, wherein the top and bottom lines not only fared better than the Zacks Consensus Estimate, but also came ahead of management’s guided ranges. Quarterly revenues and earnings also marked year-over-year improvement.
The company reported non-GAAP earnings of 39 cents per share, which outpaced the Zacks Consensus Estimate of 37 cents and came ahead of its own guidance range of 31-32 cents as well. Moreover, the figure compared favorably with the year-ago quarter’s earnings of 24 cents, mainly driven by strong top-line growth and efficient cost management, partially offset by increased number of outstanding shares.
Before discussing the fiscal third-quarter results in detail, here are some important business highlights of the quarter.
Amazon (NASDAQ:AMZN) Partnership Stoking International Growth
The company still generates only about 30% of total revenues from international operations, which is much lower than its rivals like Microsoft (NASDAQ:MSFT) or Oracle (NYSE:ORCL) composition of around 50%. Nonetheless, Salesforce noted that its partnership agreements with Amazon’s Amazon Web Services (AWS) last year have been helping it expand its international operations.
Earlier, the company used to run its software at its own data centers, which was curbing its growth potentials. However, the company decided to utilize the AWS data center’s geographical reach to expand its international business in the previous year. In addition, Salesforce has planned to invest about $400 million on AWS’ cloud platform, over the next four years.
Of late, Salesforce also entered into an agreement with AWS to run its software in the latter’s Canadian and Australian data centers. This, in turn, has opened up fresh prospects in the Canadian and Asia-Pacific markets.
During the fiscal third quarter, the company won several deals backed by its international expansion initiatives. Companies like Hilton, DuPont (NYSE:DWDP), National Australia Bank and Hitachi picked Salesforce’s solutions to fuel digital transformation.
Having discussed the third quarter business highlights, let’s now turn to the financial results.
Revenues
Salesforce continued to witness solid growth in revenues. The company’s revenues of $2.68 billion jumped 24.9% year over year and also surpassed the Zacks Consensus Estimate of $2.648 billion. Furthermore, reported revenues came above the guided range of $2.64-$2.65 billion (mid-point: $2.645 billion).
The improvement can be primarily attributable to rapid adoption of the company’s cloud-based solutions. Also, higher demand for the Salesforce ExactTarget Marketing Cloud platform, part of the Salesforce1 Customer Platform, drove the year-over-year upside in revenues.
Now, coming to its business segments, revenues at Subscription and Support climbed about 25.3% from the year-ago quarter to $2.486 billion. Professional Services and Other revenues surged almost 20.5% to $193.7 million.
Geographically, the company witnessed constant currency revenue growth of 21%, 33% and 27% in the Americas, EMEA and APAC, respectively, on a year-over-year basis.
Margins
Salesforce’s non-GAAP gross profit came in at $2.038 billion, up 25.6%. Additionally, gross margin expanded 40 basis points (bps) to 76.1% primarily owing to solid revenue growth that was partially offset by increased investment in infrastructure development including the expansion of the international data centers.
Non-GAAP operating expenses increased up 18.6% from the prior-year quarter to $1.601 billion. However, as a percentage of revenues, operating expenses decreased to 59.8% from 63% in the year-ago quarter. This was primarily because of efficient cost management.
Salesforce posted non-GAAP operating income of $436.9 million compared with the year-ago figure of $272.6 million while operating margin advanced 360 bps to 16.3%. The year-over-year increase in non-GAAP operating margin was mainly driven by improved gross margin and lower operating expenses as a percentage of revenues.
Non-GAAP net income grew 66.4% year over year to $284.4 million while net income margin expanded 260 bps to 10.6%. The benefit from improved gross margin and lower operating expenses as a percentage of revenues on net income margin was partially offset by elevated interest and other expenses.
Balance Sheet & Cash Flow
Salesforce exited the reported quarter with cash and cash equivalents and marketable securities of $3.63 billion compared with $3.50 billion in the previous quarter. Accounts receivable were $1.520 billion compared with $1.569 million at the end of the fiscal first quarter. As of Oct 31, 2017, total deferred revenues were $4.39 billion, up 26% on a year-over-year basis.
During the first three quarters of fiscal 2018, the company generated operating cash flow of $1.687 billion. Also, it generated free cash flow of $1.290 billion in the first nine months of fiscal 2018.
Guidance
Buoyed by better-than-expected fiscal third-quarter results, the company provided an encouraging guidance for the fiscal fourth quarter and raised its outlook for the full year as well. For the fiscal fourth quarter, the company anticipates revenues in the range of $2.801-$2.811 billion (mid-point: $2.806 billion), representing a year-over-year increase of 22-23%.
Further, the company expects non-GAAP earnings per share in the band of 32-33 cents. On a GAAP basis, the same is anticipated between 3 cents and 4 cents.
Additionally, Salesforce raised its revenues and earnings outlook for fiscal 2018. Revenues are now anticipated to come in the range of $10.43-$10.44 billion (mid-point $10.435 billion), up from the previous projection of $10.35-$10.40 billion (mid-point $10.375 billion), representing a 24% year-over-year increase.
By completing this target, the company is expected to achieve the $10 billion mark in revenues faster than any other enterprise software company.
Similarly, Salesforce now projects non-GAAP earnings to lie between $1.32 and $1.33 while GAAP earnings are expected to be in the range of 12-13 cents. This compares with the previous guidance range of $1.29-$1.31 on non-GAAP basis and 7-9 cents on GAAP basis.
How Have Estimates Been Moving Since Then?
Analysts were quiet during the past month as none of them issued any earnings estimate revisions.
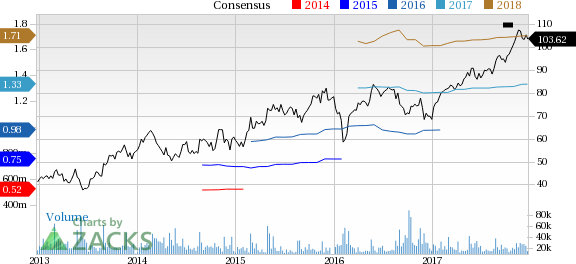
Salesforce.com Inc Price and Consensus | Salesforce.com Inc Quote
VGM Scores
At this time, the stock has a strong Growth Score of A, a grade with the same score on the momentum front. However, the stock was allocated a grade of F on the value side, putting it in the fifth quintile for this investment strategy.
Overall, stocks has an aggregte VGM Score of B. If you aren't focused on one strategy, this score is the one you should be interested in.
Zacks' style scores indicate that the company's stock is suitable for growth and momentum investors.
Outlook
The stock has a Zacks Rank #3 (Hold). We are expecting an inline return from the stock in the next few months.
Palantir remains highly valued with a 460x P/E ratio and a 42.5x P/B ratio, far above its peers. The stock's beta of 2.81 signals high volatility, meaning sharp moves in both...
The S&P 500 had started to clear resistance, posting new all-time highs before sellers struck with a vengeance. The selling was bad, similar to that seen in December, which...
Myself and others have highlighted how European Equities have been breaking out to new all-time highs on the back of bullish factors such as cheap valuations, monetary tailwinds,...
Are you sure you want to block %USER_NAME%?
By doing so, you and %USER_NAME% will not be able to see any of each other's Investing.com's posts.
%USER_NAME% was successfully added to your Block List
Since you’ve just unblocked this person, you must wait 48 hours before renewing the block.
I feel that this comment is:
Thank You!
Your report has been sent to our moderators for review
Add a Comment
We encourage you to use comments to engage with other users, share your perspective and ask questions of authors and each other. However, in order to maintain the high level of discourse we’ve all come to value and expect, please keep the following criteria in mind:
Enrich the conversation, don’t trash it.
Stay focused and on track. Only post material that’s relevant to the topic being discussed.
Be respectful. Even negative opinions can be framed positively and diplomatically. Avoid profanity, slander or personal attacks directed at an author or another user. Racism, sexism and other forms of discrimination will not be tolerated.
Perpetrators of spam or abuse will be deleted from the site and prohibited from future registration at Investing.com’s discretion.