


Sign up to create alerts for Instruments,
Economic Events and content by followed authors
Free Sign Up Already have an account? Sign In
Please try another search

Royal Caribbean Cruises Ltd. (NYSE:RCL) posted better-than-expected fourth-quarter 2017 results.
Adjusted earnings of $1.34 per share surpassed the Zacks Consensus Estimate of $1.20 by 11.7% and grew 8.9% year over year on the back of higher revenues and lower fuel costs. The bottom line came in ahead of the guided range of $1.15-$1.20.
Total revenues of $2 billion beat the consensus mark of $1.98 billion by $29 million, up 4.9% from the year-ago quarter. This upside is driven by higher passenger ticket as well as onboard and other revenues.
Double-Double: A Special Mention
The company’s Double-Double program, aimed at attaining adjusted EPS of $6.78 (double the 2014 adjusted EPS of $3.39) and increasing return on invested capital (ROIC) to double-digit percentages in 2017, achieved its targets. Last year, the company reported EPS of $7.53 and ROIC rose to above 10%. Further, Royal Caribbean focuses on its new three-year program, designed to drive performance: 20/20 Vision.
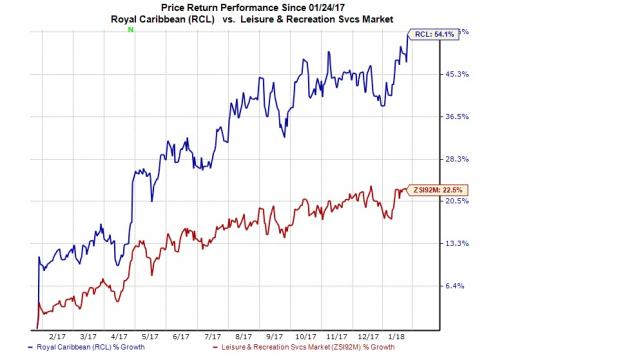
We note that the cruise operator’s shares have soared 54.1% in a year’s time, significantly outperforming the industry’s 22.5% rally.
Quarterly Highlights
Passenger ticket revenues were up 4.9% to $1.42 billion and onboard and other revenues increased 5.2% to $584.1 million.
Royal Caribbean Cruises Ltd. Revenue (TTM)
On a constant currency basis, net yields rose 3.9% year over year, surpassing the mid-point of the guided range by 165 basis points (bps). This improvement came on the back of strong close-in demand for core products and better-than-expected onboard spend.
Net cruise costs (NCC) excluding fuel, grew 8.7% on a constant currency basis, more than management’s expectation of 8.5% increase. Notably, the rise in costs was mainly due to planned investments and relief efforts for the hurricanes.
Total cruise operating expenses inched up 2% year over year to nearly $1.15 billion, mainly due to growing food, Commissions, transportation, onboard and other plus payroll and related operating costs. This was however, partly offset by decreased fuel and other operating expenses.
1Q18 Guidance
For the first quarter of 2018, Royal Caribbean expects adjusted earnings per share at roughly 95 cents, lower than the Zacks Consensus Estimate of 98 cents.
Constant-currency net yields are projected in the range of 3-3.5% increase. NCC excluding fuel is likely to be up about 10% at constant currency.
2018 Guidance
For 2018, the company anticipates earnings in the band of $8.55-$8.75 per share. The mid-point of this guided range is higher than the Zacks Consensus Estimate of $8.57.
The company expects net yields in the band of 1.5-3.5% on a constant currency basis.
NCC excluding fuel on a constant-currency basis is expected to be up 1.5-2%. Meanwhile, management noted to have been experiencing strong early booking trends for 2018.
Zacks Rank and Stocks to Consider
Royal Caribbean carries a Zacks Rank #3 (Hold). Some better-ranked stocks in the Zacks Consumer Discretionary sector are Melco Resorts & Entertainment (NASDAQ:MLCO) , Boyd Gaming Corp. (NYSE:BYD) and Hilton Worldwide Holdings (NYSE:HLT) , each with a Zacks Rank #2 (Buy). You can see the complete list of today’s Zacks #1 Rank (Strong Buy) stocks here.
Melco Resorts, Boyd Gaming and Hilton are expected to witness a respective 19.8%, 31.2% and 32.7% increase in 2018 earnings.
The Hottest Tech Mega-Trend of All
Last year, it generated $8 billion in global revenues. By 2020, it's predicted to blast through the roof to $47 billion. Famed investor Mark Cuban says it will produce "the world's first trillionaires," but that should still leave plenty of money for regular investors who make the right trades early.
See Zacks' 3 Best Stocks to Play This Trend >>
Palantir remains highly valued with a 460x P/E ratio and a 42.5x P/B ratio, far above its peers. The stock's beta of 2.81 signals high volatility, meaning sharp moves in both...
The S&P 500 had started to clear resistance, posting new all-time highs before sellers struck with a vengeance. The selling was bad, similar to that seen in December, which...
Myself and others have highlighted how European Equities have been breaking out to new all-time highs on the back of bullish factors such as cheap valuations, monetary tailwinds,...
Are you sure you want to block %USER_NAME%?
By doing so, you and %USER_NAME% will not be able to see any of each other's Investing.com's posts.
%USER_NAME% was successfully added to your Block List
Since you’ve just unblocked this person, you must wait 48 hours before renewing the block.
I feel that this comment is:
Thank You!
Your report has been sent to our moderators for review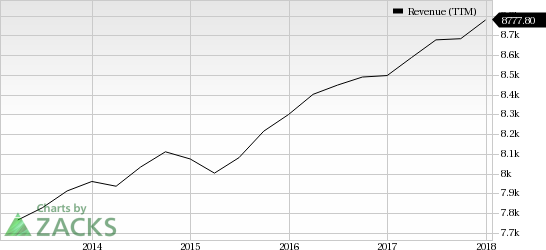

Add a Comment
We encourage you to use comments to engage with other users, share your perspective and ask questions of authors and each other. However, in order to maintain the high level of discourse we’ve all come to value and expect, please keep the following criteria in mind:
Enrich the conversation, don’t trash it.
Stay focused and on track. Only post material that’s relevant to the topic being discussed.
Be respectful. Even negative opinions can be framed positively and diplomatically. Avoid profanity, slander or personal attacks directed at an author or another user. Racism, sexism and other forms of discrimination will not be tolerated.
Perpetrators of spam or abuse will be deleted from the site and prohibited from future registration at Investing.com’s discretion.