


Sign up to create alerts for Instruments,
Economic Events and content by followed authors
Free Sign Up Already have an account? Sign In
Please try another search

A month has gone by since the last earnings report for PS Business Parks, Inc. (NYSE:PSB) . Shares have added about 1.5% in that time frame.
Will the recent positive trend continue leading up to the stock's next earnings release, or is it due for a pullback? Before we dive into how investors and analysts have reacted of late, let's take a quick look at its most recent earnings report in order to get a better handle on the important drivers.
PS Business Parks Q3 FFO and Revenues Top Estimates
PS Business Parks reported third-quarter 2017 core FFO of $1.54 per share, surpassing the Zacks Consensus Estimate by a penny. Moreover, the figure came in 7.7% higher than $1.43 recorded in the prior-year quarter.
The rise stemmed from higher net operating income (NOI), reduced general and administrative expenses, and savings from lower preferred distributions.
Rental income came in at around $100.5 million, marking 3.2% growth from the year-ago figure. Additionally, the figure outpaced the Zacks Consensus Estimate of $99.4 million.
Quarter in Detail
Same Park rental income was up 4.4% year over year, while Same Park operating expenses flared up 3.2%. As a result, Same Park NOI climbed 5% year over year, mainly on the back of improving rental rates.
Annualized Same Park realized rent per square foot rose 4.6% year over year to $15.32. Same Park weighted average occupancy in the quarter was 94%, down 10 basis points (bps) year over year.
Liquidity
PS Business Parks exited third-quarter 2017 with cash and cash equivalents of 132.7 million, higher than the prior-year end tally of $128.6 million.
How Have Estimates Been Moving Since Then?
Following the release, investors have witnessed an upward trend in fresh estimates. There has been one revision higher for the current quarter
PS Business Parks, Inc. Price and Consensus
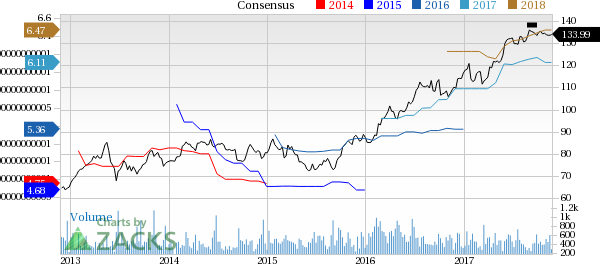
PS Business Parks, Inc. Price and Consensus | PS Business Parks, Inc. Quote
VGM Scores
At this time, PS Business Parks' stock has an average Growth Score of C, a grade with the same score on the momentum front. However, the stock was allocated a grade of D on the value side, putting it in the bottom 40% for this investment strategy.
Overall, the stock has an aggregate VGM Score of D. If you aren't focused on one strategy, this score is the one you should be interested in.
The company's stock is suitable for growth and momentum investors based on our style scores.
Outlook
While estimates have been broadly trending upward for the stock, the magnitude of these revisions has been net zero. Notably, the stock has a Zacks Rank #3 (Hold). We expect in-line returns from the stock in the next few months.
Over the weekend I warned about the weakness in the Semiconductor sector (SMH). I also wrote about Granny Retail XRT, and how important it is for that sector to stay alive. Both...
Pretty rough day out there—S&P 500 down about 1.8%, Nasdaq down around 2.2%, and small caps hit even harder, dropping 2.7%. However, the S&P 500 is approaching a crucial...
Two weeks ago, the rumor mill ramped up again about the potential restructuring of Intel Corporation (NASDAQ:INTC). The probing balloons centered around Taiwan Semiconductor...
Are you sure you want to block %USER_NAME%?
By doing so, you and %USER_NAME% will not be able to see any of each other's Investing.com's posts.
%USER_NAME% was successfully added to your Block List
Since you’ve just unblocked this person, you must wait 48 hours before renewing the block.
I feel that this comment is:
Thank You!
Your report has been sent to our moderators for review
Add a Comment
We encourage you to use comments to engage with other users, share your perspective and ask questions of authors and each other. However, in order to maintain the high level of discourse we’ve all come to value and expect, please keep the following criteria in mind:
Enrich the conversation, don’t trash it.
Stay focused and on track. Only post material that’s relevant to the topic being discussed.
Be respectful. Even negative opinions can be framed positively and diplomatically. Avoid profanity, slander or personal attacks directed at an author or another user. Racism, sexism and other forms of discrimination will not be tolerated.
Perpetrators of spam or abuse will be deleted from the site and prohibited from future registration at Investing.com’s discretion.