As suspected, the gains seen last week in both gold and silver (and copper for that matter) were primarily the result of short covering. My view is that the bulk of this was tied to year-end book squaring ahead of Christmas and the New Year’s holiday.
Starting with gold..
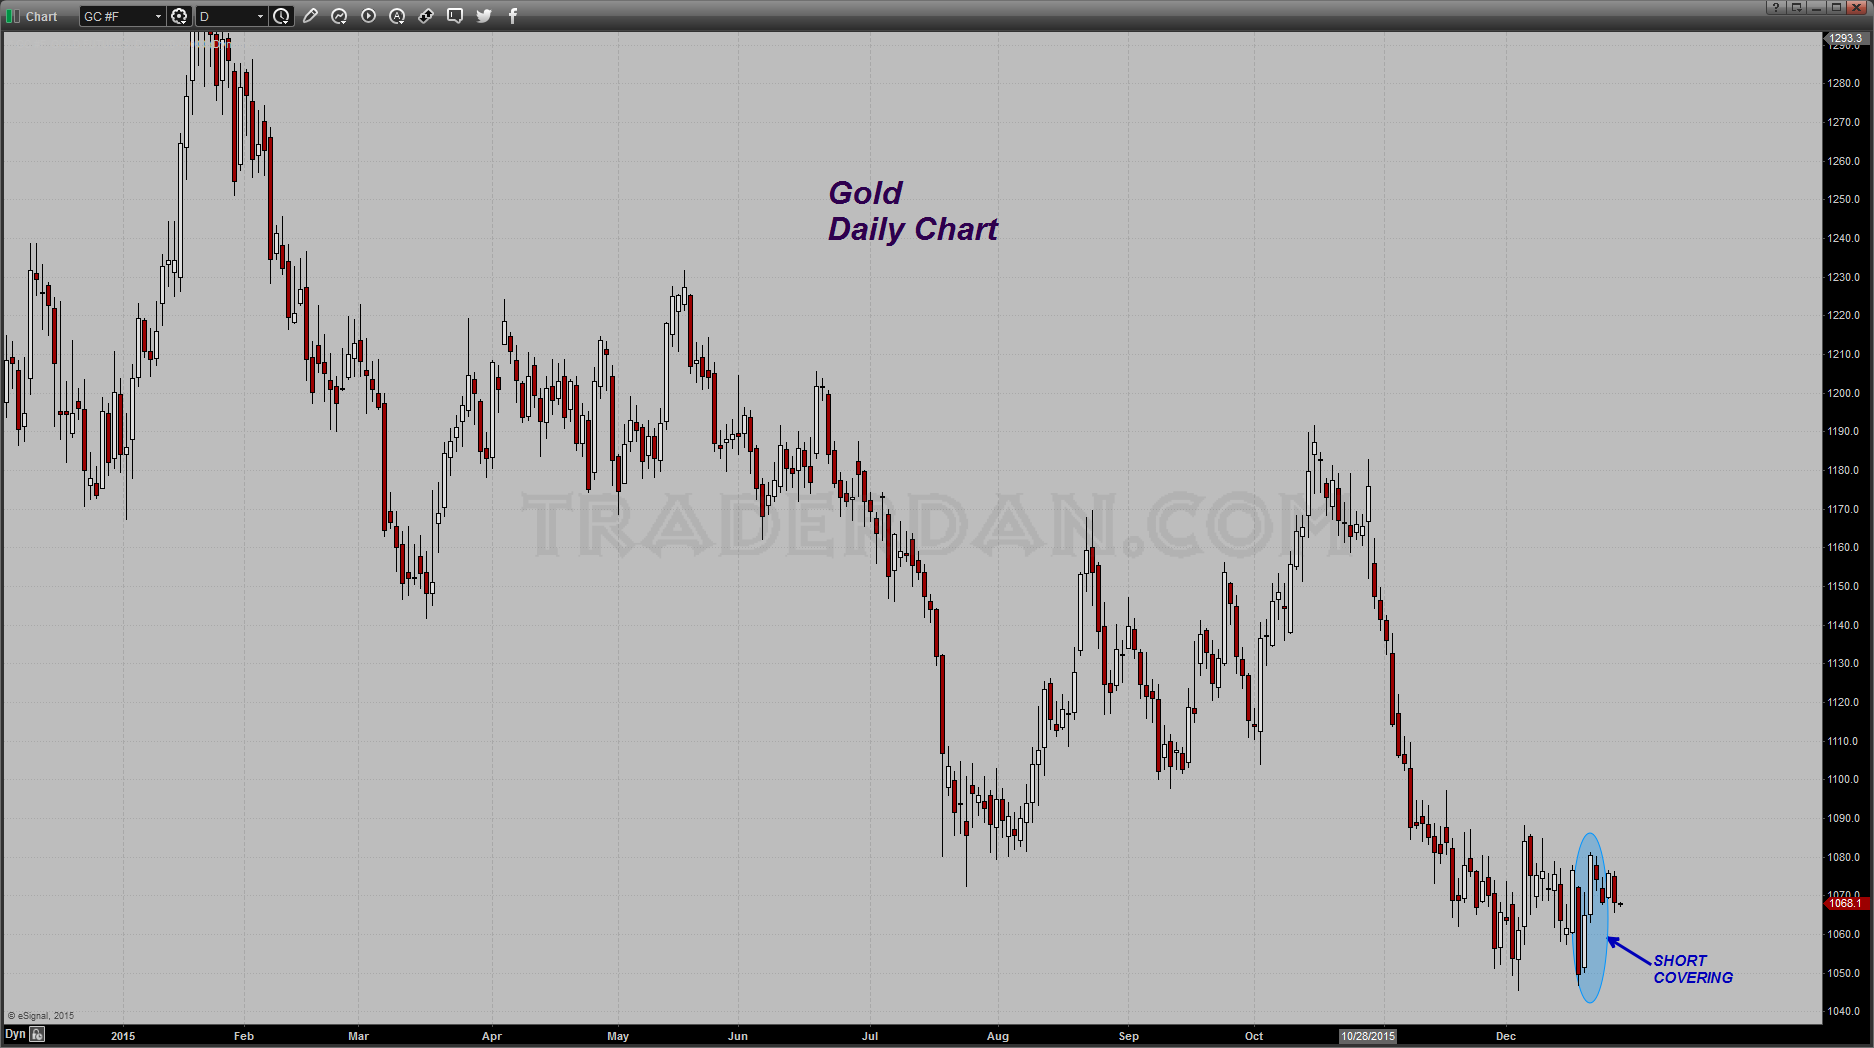
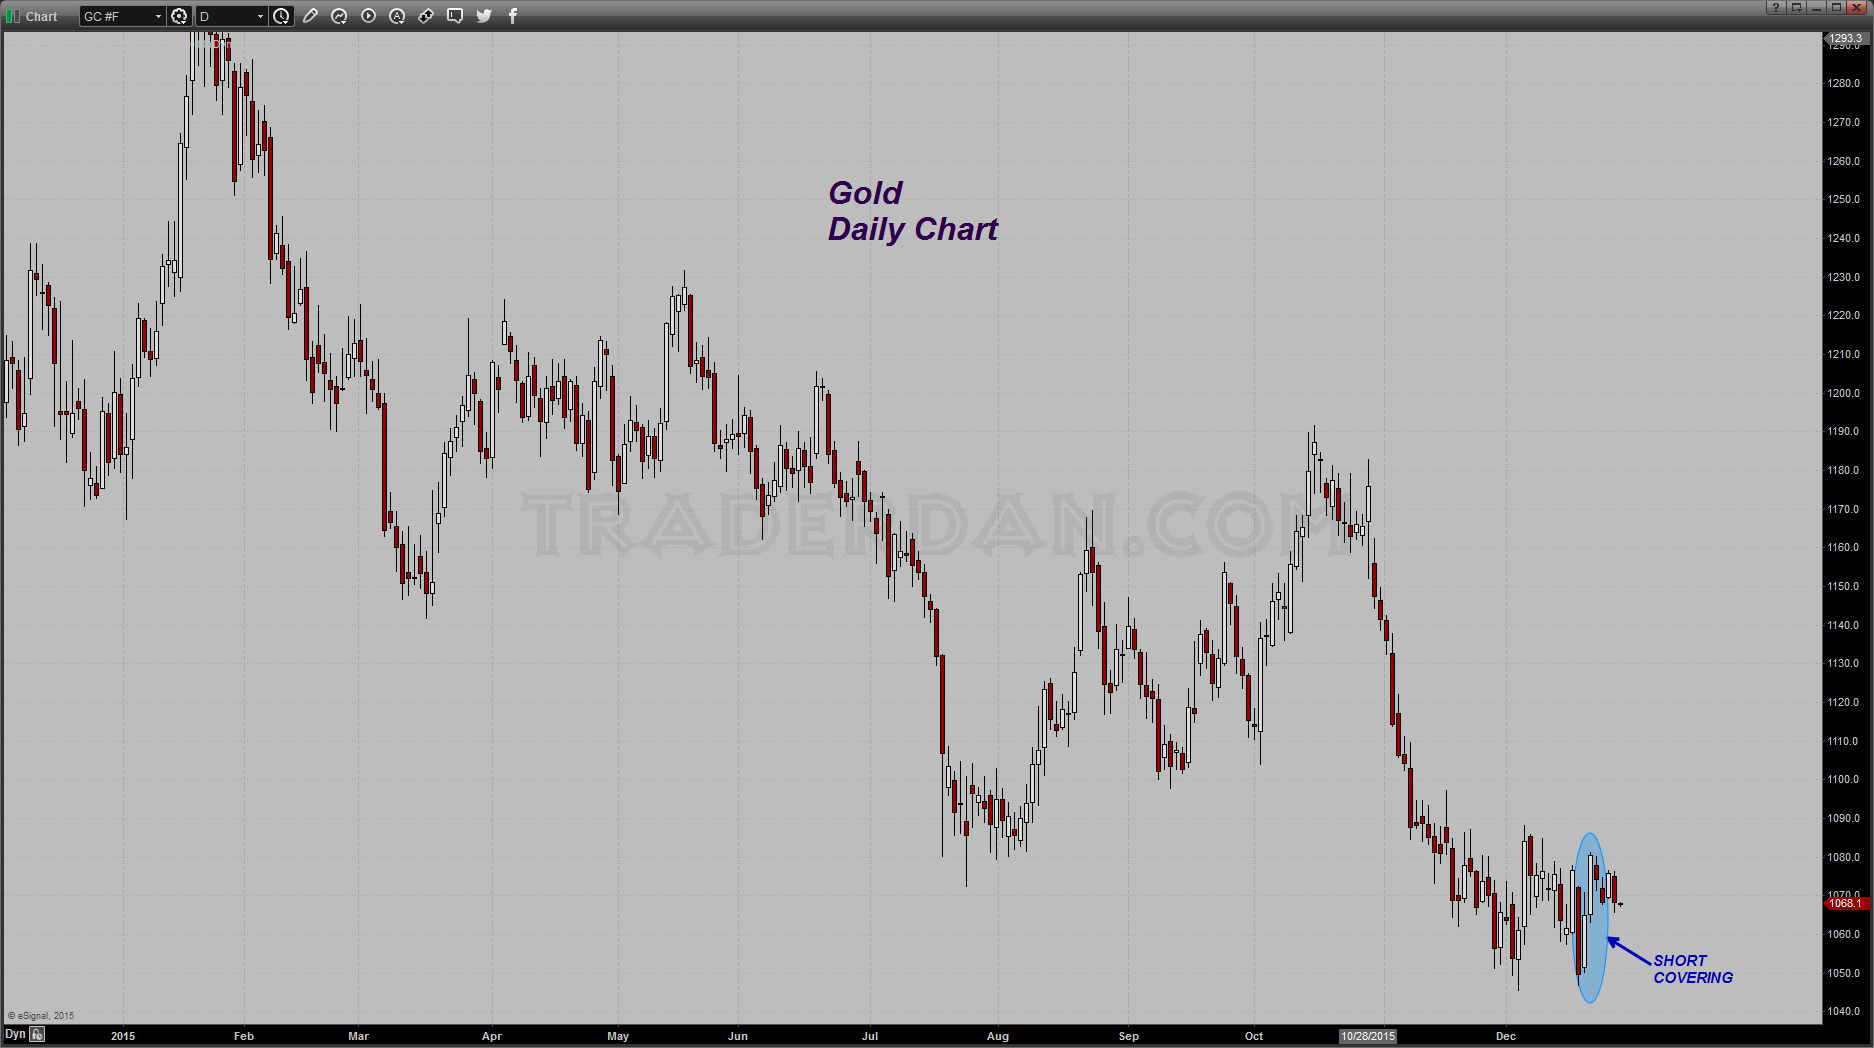
It should come as no secret to the readers of this site that the money to be made trading gold this year has come from the short side. With bears raking in the brunt of trading profits, it is only logical (and sensible) to expect them to book those gains and realize them.
As you can see from the chart, their buying was good for a $30+ move off the lows.
Here is the updated COT chart.
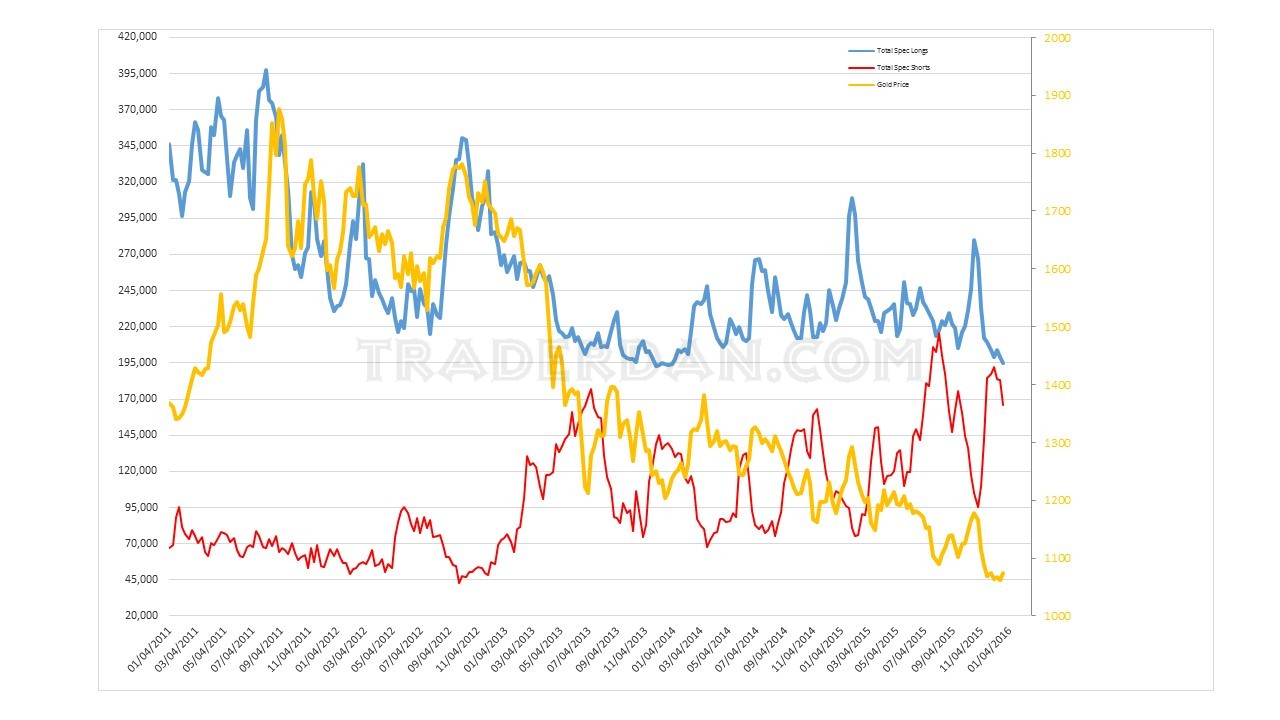
You can see from looking at this chart that there was long liquidation that occurred over this past reporting period but most of that took place on December 17th when gold collapsed over $30 in a single day. That day was then followed by two consecutive days of short covering which was picked up on this reporting period and is observable on the chart.
The same thing happened in silver. Here is a reposting of that same silver chart I loaded on the site earlier today.
You can see the sharp selloff on December 17th which was followed by the same two days of short covering that occurred in gold.
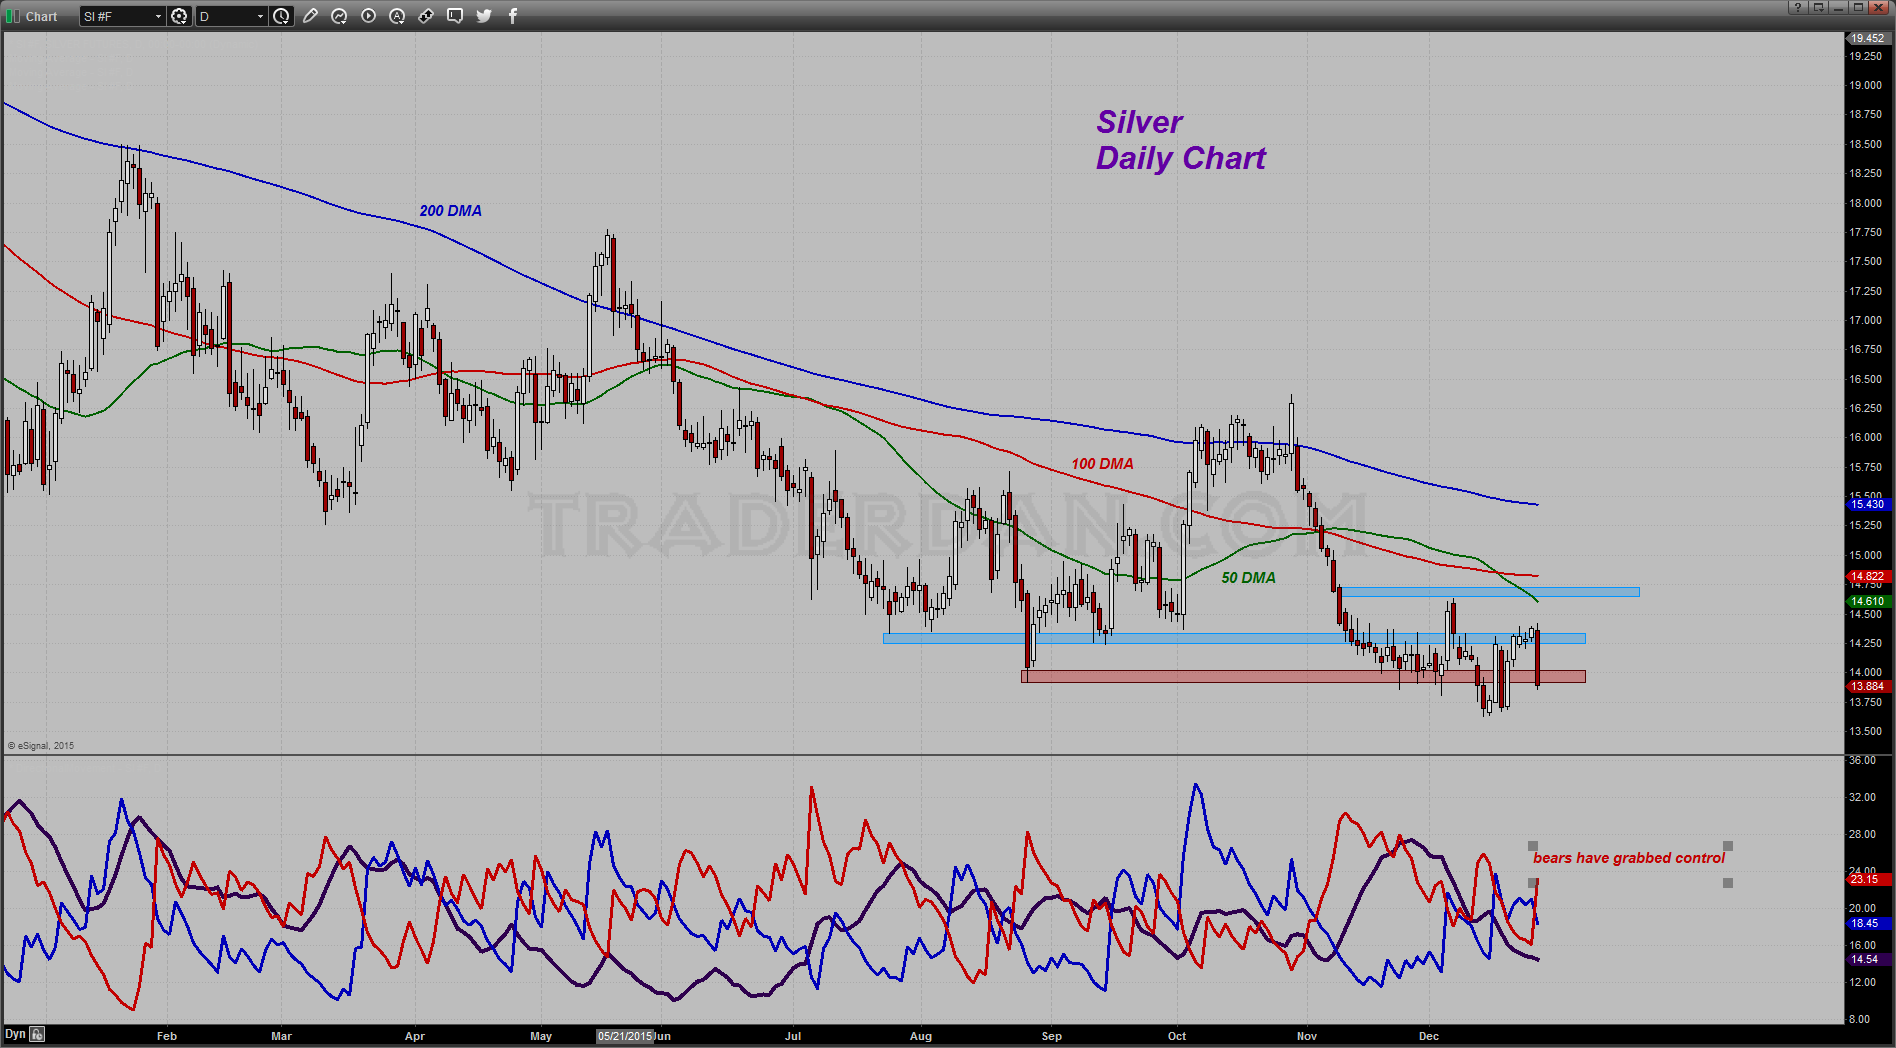
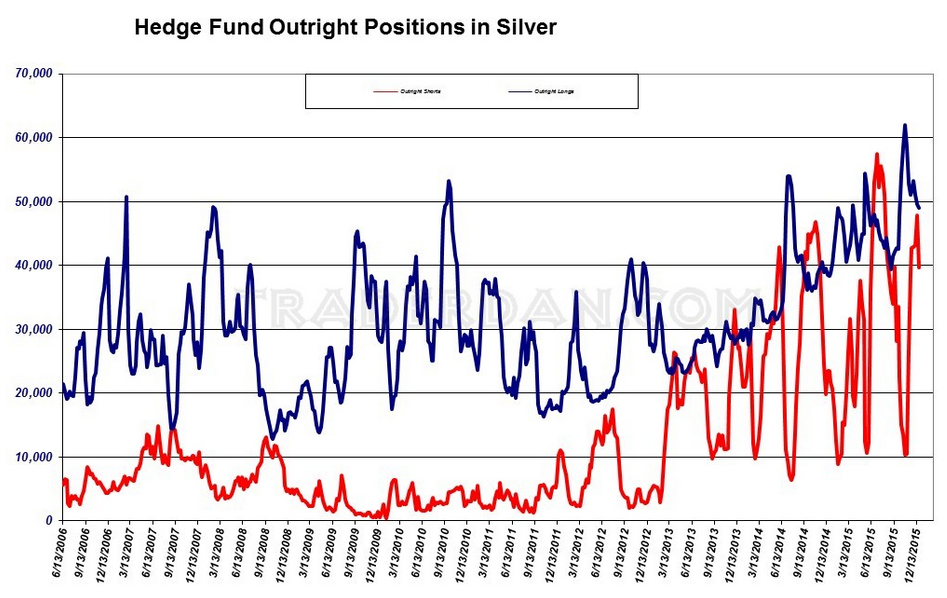
As you can see, as was the case with gold, both long liquidation took place over this reporting period that ended Tuesday of last week as well as short covering. The brunt of the long liquidation occurred on the 30 cent price plunge on December 17th that dropped the price below $13.75. The next two days were when the short covering occurred as price then retraced the entire loss of the 17th and then some.
Today, we are right back below $14 once more.
As noted many times now over the past two weeks, both gold and silver remain mired in range trades. Maybe they will go somewhere next year but if the yield curve is any indication, the gold bulls may not be including that in their New Year’s wish list.
I should note here, that the speculators continue shooting themselves in the foot as they remain NET LONG silver in a brutal bear market.
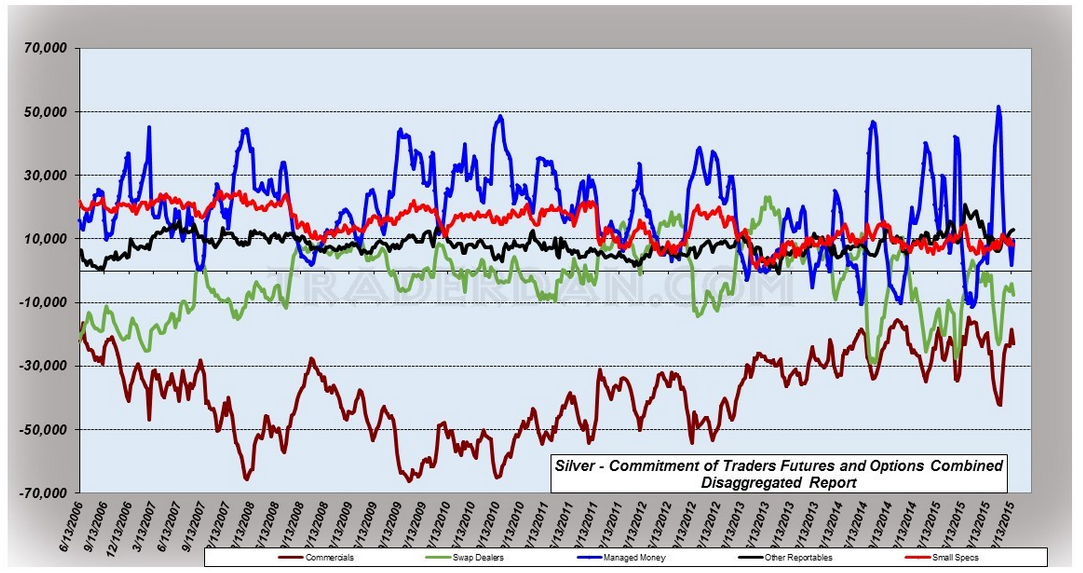
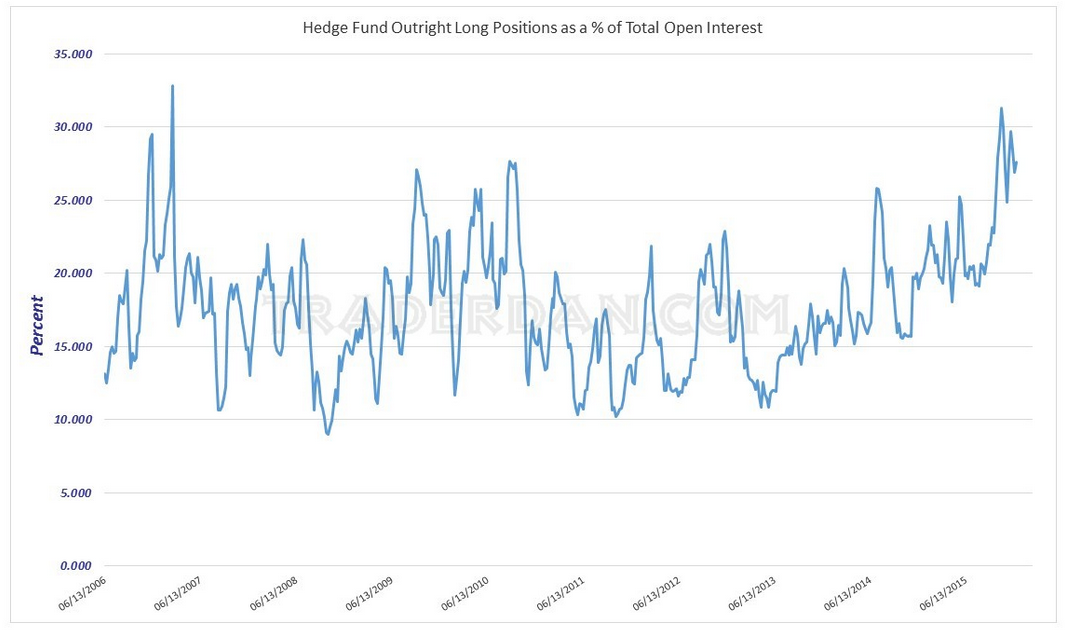
As a matter of fact, the hedge funds continue to hold not far off the all time record high for outright long positions. They are approximately 13,000 longs off their October peak scored a couple of months ago. Clearly, these guys have not had any fun this year in the silver market!
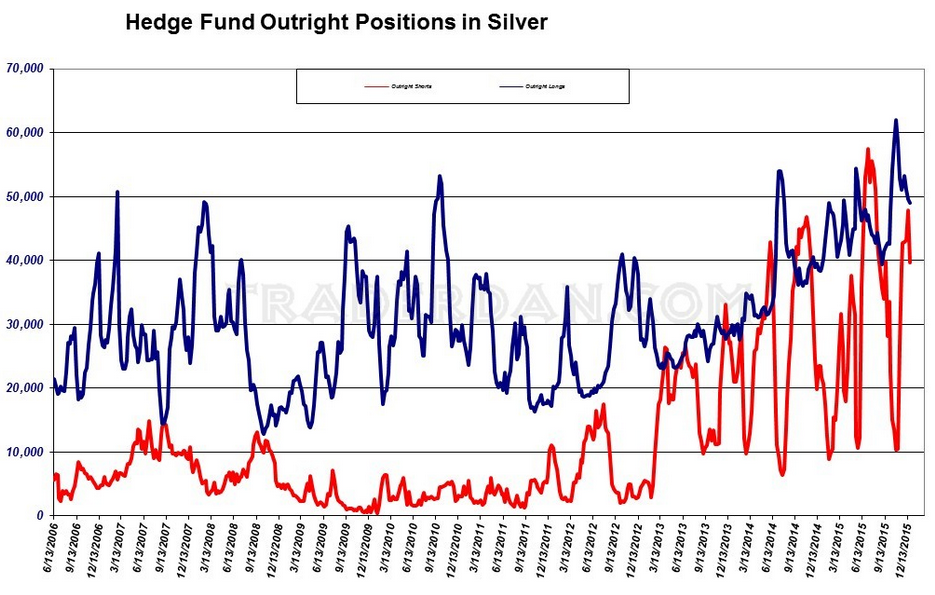
Lastly, here is the same data plotted in a percentage term.
