
- Cover short 9/3/13 at 1639.77=gain 1.3%
- Short SPX on 8/15/13 at 1661.32.
- Gold ETF GLD long at 173.59 on 9/21/11.
- Long-Term Trend monitor purposes: Flat
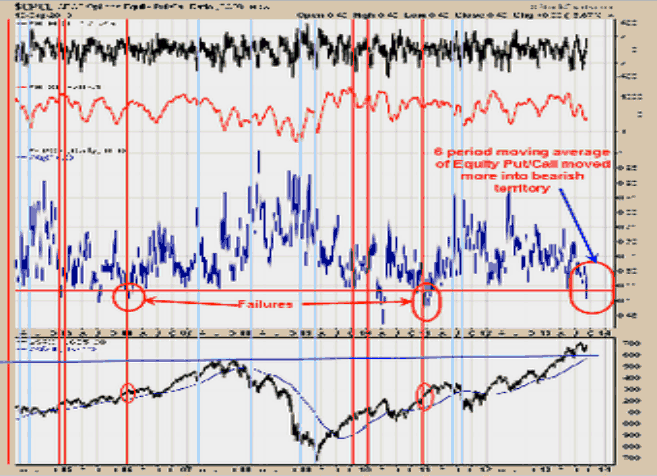
We have updated this chart from yesterday. The middle window is the six-period moving average of the equity Put/Call ratio. It common for a top to form in the SPX when the 6 period moving average of the equity Put/Call ratio reaches .54 or lower. The chart above goes back to mid 2004 and in that time the ratio reached the .54 level or lower twelve times and three of those times where failures. The moving average Equity Put/Call ratio moved more into bearish territory closing yesterday at .50 down from .54 the day before. Today’s modest rally in the SPX may have pushed the ratio lower but we won’t know tell later tonight when the ratio is updated. Previous readings this low did mark tops in the SPX in 2007; April 2010; March 2012 and May 2013, so it’s worth noting.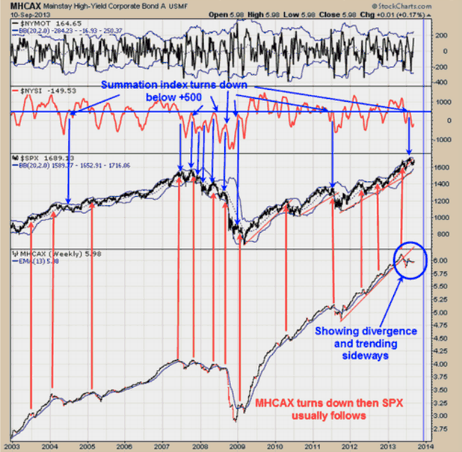 Above is the Mainstay High Yield Corporate Bond A (MHCAX). Normally when MHCAX turns down then the SPX usually follows. MHCAX turned down in May and the SPX followed. The SPX when on to make a new high in August but MHCAX made a much lower high and setups up a negative divergence. Over the Last week or so the SPX has pushed higher but the MHCAX has just trended sideways and not confirm the SPX advance. The second window down from the top is the McClellan Summation index. The nastiest of declines occur when the Summation index turns down from below +500 and its below +500 now but still trending higher. The FOMC meeting is next Tuesday and Wednesday and the market may push into that time frame quietly. If the Advance/Decline line is falling into the FOMC meeting than that will affect the McClellan Summation index and could turn it down and trigger a sell signal. If the Advance/Decline line remains positive than that will be a bullish sign for the market. We are leaning to the bearish side of things but for now we have to say the trend is still up but there are negative divergences.
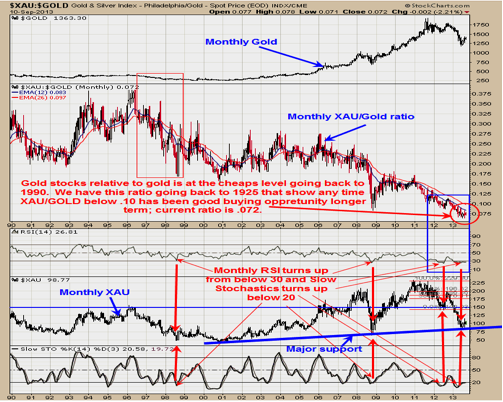 The chart above is the monthly XAU/Gold ratio with its monthly RSI and Slow Stochastics. Longer term bullish signals are triggered for the XAU when the Monthly RSI of the XAU/Gold ratio turns up from below 30 and the monthly Slow Stochastic turns up from below 20. These signals are rare. A bullish signal came back in 1998 but was short lived. The on that came in 2008 was a big winner. The bullish signal in 2012 had a good percent run but was also short lived and now we have the current buy signal. We have drawn a trend line up from the 2000 low on the XAU and has hit that support and turned up which suggests that support is valid. We have the XAU/Gold ratio chart going back to 1925 and anytime this ratio reached .10, it had been a longer term bullish signal for gold stocks 83% of the time. The ratio closed today at .072 so we don’t think the current developing rally will be short lived. From our studies each time the ratio reached .10 (total of six times since 1925) and turned up the gold stocks went on to new highs; the only exception was in 2012. Therefore there is an 83% chance that the XAU will hit new highs, not bad odds.
- Long NG at 5.14 on 10/8/12.
- Long GDX at 58.65 on 12/6/11.
- Long GLD at 173.59 on 9/21/11.
- Long GDXJ average 29.75 on 4/27/12.
- Long BRD at 1.67 on 8/3/11.
- Long YNGFF .44 on 7/6/11.
- Long EGI at 2.16, on 6/30/11.
- Long KBX at 1.13 on 11/9/10.
- Long LODE at 2.85 on 1/21/11.
- Long UEXCF at 2.07 on 1/5/11.
We will hold as our core position in AUQ, CDE and KGC because in the longer-term view, these issues will head much higher. Holding CDE, average long at 27.7. Long cryxf at 1.82 on 2/5/08. KGC long at 6.07. Long AUQ average of 8.25.