Many market events occurred in January and it was important to see how things would unfold. After all, we just came out of the worst December in eighty years. This period saw the indices at one point dip more than 10% (just before Christmas). The year finished off with a flurry of buying, the biggest buying day in years ensued the day after the Christmas holiday.
The S&P 500 finished 2018 with a 6.3% loss after being higher by more than 10% just a few months early.
In a reversal of fortune, the month/year started off strong and continued to move toward the upside. The SPX 500 finished January with a gain of nearly 8%, which is a blistering pace. We know that cannot continue, especially since we are still in a bear market. Yes, I said it. The longer-term trends have not shifted enough to call off the bear label. It's getting close to it.
The monthly chart still shows the MACD crossover as bearish. This is the clue we used to form our bearish analysis back in October, and it still applies. When the black line crosses above the red line (thick over the thin) then we'll have a change in trend. So, with a strong month of January offsetting the December losses, you might say it has already changed. Not so fast.
Resistance is very heavy just ahead of the indices, the 200 ma is in sight and could be tested within weeks. That might the time market players say 'that is enough' for now. I find that markets move in six-week fractals, so the middle of February might be the end of this run for a bit. A breather or even a pullback would be nice, a bit of back n' fill to re-assess positions and strength.
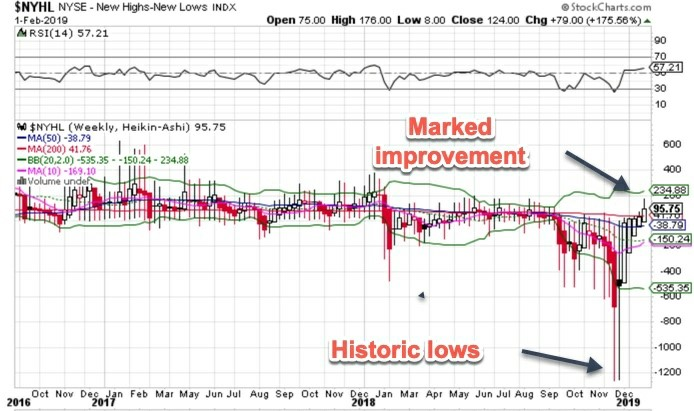
A sign of good things is the new high/new low list, which hit some off the chart low levels back in December. The improvement here is remarkable as you can see from the chart below. We often see this indicator take months to improve its status. It only took about a month for that about face to occur.
Another sign is the very weak volatility index, which closed at a multi-month low as some uncertainties (like the Fed) were removed. Breadth has been outstanding while the put/call ratio continues to sink lower. All signs that the rally can continue on, but always with some cautionary flags waving.