


Sign up to create alerts for Instruments,
Economic Events and content by followed authors
Free Sign Up Already have an account? Sign In
Please try another search

A month has gone by since the last earnings report for L3 Technologies Inc. (NYSE:LLL) . Shares have added about 2% in that time frame, outperforming the market.
Will the recent positive trend continue leading up to its next earnings release, or is LLL due for a pullback? Before we dive into how investors and analysts have reacted of late, let's take a quick look at its most recent earnings report in order to get a better handle on the important drivers.
L3 Technologies Q4 Earnings Top, Raises '18 EPS View
L3 Technologies posted fourth-quarter 2017 adjusted earnings of $2.35 per share from continuing operations, surpassing the Zacks Consensus Estimate of $2.30 by 2.2%.
The company reported earnings of $3.34 which was higher than the prior-year quarter’s equivalent of $2.32 per share. The improvement was led by a tax benefit of 99 cents on account of the recent U.S. tax reforms.
Total Revenues
Total revenues of $2.57 billion in the quarter beat the Zacks Consensus Estimate of $2.55 billion by 1.1%. However, the top line was down 3% year over year.
Organic sales to the U.S. government inched up 0.4%, while that to international and commercial customers declined 12%. Overall, organic sales dropped 4%.
Orders & Margin
Funded orders in 2017 were $9.9 billion, reflecting a 5% rise compared to last year. Funded backlog was $9 billion as of Dec 31, 2017, up 6% from $8.4 billion as of Dec 31, 2016.
Operating margin contracted 50 basis points (bps) to 10.2% in the quarter.
Segmental Performance
Electronic Systems: Net sales at the segment declined 7% to $803 million from the prior-year figure of $861 million, mainly on account of significant organic sales decline.
Operating income was $110 million compared with the year-ago figure of $109 million, while operating margin expanded 100 bps to 13.7%.
Aerospace Systems: The segment recorded net sales of 727 million in the quarter, down annually by $1 million. The downside was attributed to lower volume for large ISR aircraft systems for foreign military customers.
While operating income increased to $58 million from $50 million, operating margin expanded 110 bps to 8%.
Communication Systems: Net sales at the segment improved about 3% to $602 million, primarily owing to increased volume and deliveries of secure networked communication systems to the U.S. Department of Defense.
While operating income dropped 16% to $47 million, operating margin contracted 180 bps to 7.8%.
Sensor Systems: Net sales at the segment declined 6% to $442 million on account of lower organic sales.
Operating income dropped 28% to $48 million and operating margin contracted 330 bps to 10.9%.
Financial Position
As of Dec 31, 2017 L3 Technologies had $662 million in cash and cash equivalents compared with $363 million as of Dec 31, 2016.
Long-term debt as of Dec 31, 2017, was $3,330 million compared with $3,325 million as of Dec 31, 2016.
Net cash from operating activities was $986 million at the end of 2017, down 3.5% from the year-ago figure. Capital expenditure totaled $224 million compared with $210 million in the prior year.
2018 Guidance
L3 Technologies raised its 2018 earnings outlook. The company now expects earnings in the range of $9.30-$9.50 per share (versus the prior range of $8.60-$8.85). Revenue guidance was reiterated at $9,850-$10,050 million.
The company also raised its expectation of cash from operations to $1,145 million from $1,110 million and resultant free cash flow to $900 million from $865 million.
How Have Estimates Been Moving Since Then?
Analysts were quiet during the last month as none of them issued any earnings estimate revisions.
L3 Technologies Inc. Price and Consensus
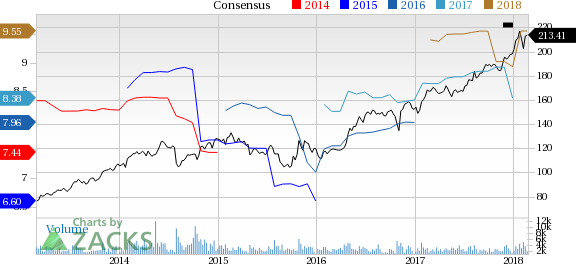
L3 Technologies Inc. Price and Consensus | L3 Technologies Inc. Quote
VGM Scores
Currently, LLL has a subpar Growth Score of D. It lags a bit on the momentum front with an F. The stock was also allocated a grade of D on the value side, putting it in the bottom 40% for this investment strategy.
Overall, the stock has an aggregate VGM Score of D. If you aren't focused on one strategy, this score is the one you should be interested in.
Our style scores indicate investors will probably be better served looking elsewhere.
Outlook
LLL has a Zacks Rank #2 (Buy). We expect an above average return from the stock in the next few months.
Palantir remains highly valued with a 460x P/E ratio and a 42.5x P/B ratio, far above its peers. The stock's beta of 2.81 signals high volatility, meaning sharp moves in both...
The S&P 500 had started to clear resistance, posting new all-time highs before sellers struck with a vengeance. The selling was bad, similar to that seen in December, which...
Myself and others have highlighted how European Equities have been breaking out to new all-time highs on the back of bullish factors such as cheap valuations, monetary tailwinds,...
Are you sure you want to block %USER_NAME%?
By doing so, you and %USER_NAME% will not be able to see any of each other's Investing.com's posts.
%USER_NAME% was successfully added to your Block List
Since you’ve just unblocked this person, you must wait 48 hours before renewing the block.
I feel that this comment is:
Thank You!
Your report has been sent to our moderators for review
Add a Comment
We encourage you to use comments to engage with other users, share your perspective and ask questions of authors and each other. However, in order to maintain the high level of discourse we’ve all come to value and expect, please keep the following criteria in mind:
Enrich the conversation, don’t trash it.
Stay focused and on track. Only post material that’s relevant to the topic being discussed.
Be respectful. Even negative opinions can be framed positively and diplomatically. Avoid profanity, slander or personal attacks directed at an author or another user. Racism, sexism and other forms of discrimination will not be tolerated.
Perpetrators of spam or abuse will be deleted from the site and prohibited from future registration at Investing.com’s discretion.