


Sign up to create alerts for Instruments,
Economic Events and content by followed authors
Free Sign Up Already have an account? Sign In
Please try another search

Interactive Brokers Group, Inc.’s (NASDAQ:IBKR) Electronic Brokerage segment reported a year-over-year increase in Daily Average Revenue Trades (DARTs) for November 2017. The segment deals in clearance and settlement of trades for individual and institutional clients globally.
Following the announcement, shares of the company rallied 1.8%.
Total client DARTs came in at 795,000, up 9% from November 2016 and 14% from October 2017. Also, total customer accounts jumped 25% year over year and 2% from the prior month to 474,000.
Further, net new accounts totaled 9,500 for the reported month, surging a whopping 83% from the prior-year period and 20% from the last month. However, on an annualized basis, the company recorded Cleared Average DARTs per customer account of 395,000 in November. This reflects a decrease of 12% year over year but rose 12% from the previous month.
Interactive Brokers’ total option contracts came in at 27.8 million, increasing 13% from November 2016 and 5% from October 2017. Future contracts declined 12% from November 2016, however grew 12% from the October 2017 level to 10.9 million.
At the end of November 2017, client equity was $121.6 billion, surging 44% year over year and 1% from the previous month. Also, Interactive Brokers recorded client credit balance of $47.3 billion in the reported month, up 12% year over year and relatively on par with the prior month. Furthermore, the company’s customer margin loan balance of $27.1 billion soared 51% from the prior-year period and 7% from the preceding month.
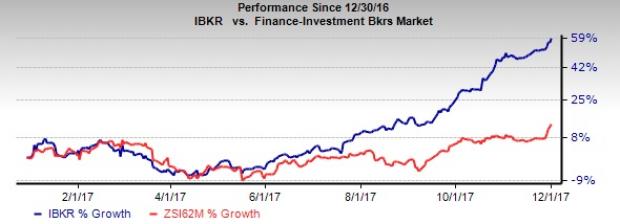
So far this year, Interactive Brokers’ shares have gained 59.1% compared with the industry’s rally of 13.9%.
The fortune of Nvidia (NASDAQ:NVDA) is closely tied to Big Tech hyperscalers. Although the AI/GPU designer didn’t name its largest clients in the latest 10-K filing on Wednesday,...
Home improvement retailers Lowe’s (NYSE:LOW) and Home Depot (NYSE:HD) turned a corner, and their Q4 2024 earnings reports confirmed it. The corner is a return to comparable store...
One of our old flames, a former Contrarian Income Portfolio holding, has pulled back sharply in recent weeks. Time to buy the dip in this 4.3% dividend? Let’s discuss. Kinder...
Are you sure you want to block %USER_NAME%?
By doing so, you and %USER_NAME% will not be able to see any of each other's Investing.com's posts.
%USER_NAME% was successfully added to your Block List
Since you’ve just unblocked this person, you must wait 48 hours before renewing the block.
I feel that this comment is:
Thank You!
Your report has been sent to our moderators for review
Add a Comment
We encourage you to use comments to engage with other users, share your perspective and ask questions of authors and each other. However, in order to maintain the high level of discourse we’ve all come to value and expect, please keep the following criteria in mind:
Enrich the conversation, don’t trash it.
Stay focused and on track. Only post material that’s relevant to the topic being discussed.
Be respectful. Even negative opinions can be framed positively and diplomatically. Avoid profanity, slander or personal attacks directed at an author or another user. Racism, sexism and other forms of discrimination will not be tolerated.
Perpetrators of spam or abuse will be deleted from the site and prohibited from future registration at Investing.com’s discretion.