


Sign up to create alerts for Instruments,
Economic Events and content by followed authors
Free Sign Up Already have an account? Sign In
Please try another search

Although natural resources finally turned around from a rough patch registered in the first half of 2013, soft commodities are still finding it difficult to stay afloat. This is particularly true for commodities like corn – one of the most important U.S. crops.
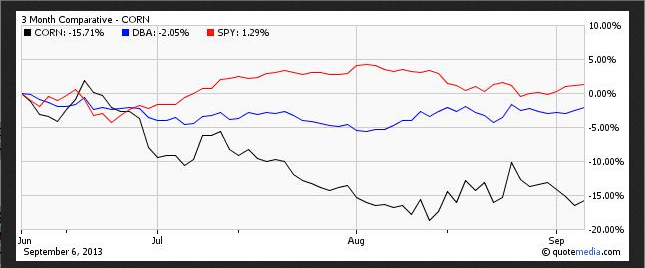
In fact, the Teucrium Corn Fund (CORN) has been down more than 15.7% in the past three month period, underperforming the broad agricultural commodity fund PowerShares DB Agriculture Fund (DBA) which was down by 2.1% and equity-based fund SPDR SP 500 ETF (SPY) which actually gained in the said period.
Thanks to a massive drought in 2012 which created supply crunch in the food market, CORN emerged as a star performer in the latter half of 2012. But this is just one side of the coin.
The bright scenario of last year in corn investing began to fade as the year 2013 progressed with favorable weather conditions and easing supply concerns (read: Should You Avoid These Agricultural ETFs in 2013?).
Favorable Weather For Production
The agricultural commodity market is largely a function of weather and thus subject to extreme volatility. Forecast of more rain in largest corn producing areas will likely benefit yield in the coming months thus pushing up the supply of corn and accordingly the price of the commodity. Based on this news, Corn futures fell to a three-week low (Read: Corn ETF Continues Plunge).
According to the U.S. Department of Agriculture (USDA), U.S. corn production will reach a record-high level of 13.8 billion bushels in 2013 representing 28% growth from the drought-stricken last year. This, along with tepid demand suggests bearish fundamentals for corn.
Pressure On Export
Further, currently the U.S. enjoys the status of being the world’s largest corn exporter. Anemic growth in the global economy and lingering concerns over macro uncertainty has dragged down overall agricultural consumption so far this year which has hurt corn export sales.
Also Argentina, the second-largest corn exporter, positioned itself as a key exporter to world economies. As per USDA, Argentine farmers hailing from southern hemisphere get to enjoy the advantage of discovering the size of the U.S. crop beforehand and planting their crops accordingly, resulting in a fast, market-based supply response.
Hence, stiff foreign competition also lowered the prices of U.S. corn in the export market. A stronger U.S. dollar is also making exports expensive, posing another around of threat to the export.
Alternatives In Ethanol Production
Historically, corn has been used as a key ingredient in ethanol production. However, the emergence of wood waste and other vegetative matter as an alternative source of ethanol production might dent the demand for this corp.
ETF Impact
Given the demand/supply imbalances in corn, the related ETF is expected to hurtle downward at least in the near term.
Corn In Focus
The fund provides investors a direct exposure to corn. The product is expensive as it charges 199 bps in fees per year which is quite higher than the average expense ratio prevailing in agricultural commodities ETFs.
It trades in moderate volumes of nearly 70,000 shares on average daily basis that increases the trading cost in the form of a somewhat wide bid/ask spread.
The fund has so far attracted $47.8 million in assets this year. It lost more than 19.0% of its value so far in 2013.
As such, CORN currently carries a Zacks ETF Rank of 5 or ‘Strong Sell’, indicating that the fund might face significant bearishness in the months ahead.
Presently, the fund is hovering just over its 52-week low price of $34.05 per share, currently trading in the Mid-30’s per share. We believe there is little room for upside for the product covered, based on current supply-demand dynamics.
The silver market is forecast to record a fifth straight market deficit in 2025, with demand once again outstripping supply, and the majority of the existing above ground silver...
Trumping Brent Oil Futures. Oil got Trumped and dumped. While many people feared that President Trump aggressive trade negotiations would raise the price of oil, so far oil has...
Upon analysis of the wobbly moves since Tuesday, when the natural gas futures tested the two-year high at $4.55, Thursday might be a cozy one, as the inventory announcements after...
Are you sure you want to block %USER_NAME%?
By doing so, you and %USER_NAME% will not be able to see any of each other's Investing.com's posts.
%USER_NAME% was successfully added to your Block List
Since you’ve just unblocked this person, you must wait 48 hours before renewing the block.
I feel that this comment is:
Thank You!
Your report has been sent to our moderators for review
Add a Comment
We encourage you to use comments to engage with other users, share your perspective and ask questions of authors and each other. However, in order to maintain the high level of discourse we’ve all come to value and expect, please keep the following criteria in mind:
Enrich the conversation, don’t trash it.
Stay focused and on track. Only post material that’s relevant to the topic being discussed.
Be respectful. Even negative opinions can be framed positively and diplomatically. Avoid profanity, slander or personal attacks directed at an author or another user. Racism, sexism and other forms of discrimination will not be tolerated.
Perpetrators of spam or abuse will be deleted from the site and prohibited from future registration at Investing.com’s discretion.