


Sign up to create alerts for Instruments,
Economic Events and content by followed authors
Free Sign Up Already have an account? Sign In
Please try another search

A month has gone by since the last earnings report for Hormel Foods Corporation (NYSE:HRL) . Shares have added about 5.5% in that time frame, outperforming the market.
Will the recent positive trend continue leading up to the stock's next earnings release, or is it due for a pullback? Before we dive into how investors and analysts have reacted of late, let's take a quick look at the most recent earnings report in order to get a better handle on the important catalysts.
Fourth-Quarter FY17 Highlights
Hormel Foods reported better-than-expected results for fourth-quarter fiscal 2017 (ended October).
Earnings: Adjusted earnings came in at 41 cents per share, a penny higher than the Zacks Consensus Estimate. However, the bottom line fell short of the year-ago tally of 45 cents.
Revenues for fiscal 2017 came in at $1.57 per share, lower than the year-ago tally of $1.64.
Revenues: In the fiscal fourth quarter, Hormel Foods generated net sales of $2,492.6 million, exceeding the Zacks Consensus Estimate of $2,394 million. However, the top line was lower than $2,627.9 million, the figure recorded in the year-ago comparable period.
Revenues for fiscal 2017 came in at $9,167.5 million compared with $9,523.2 million from the year-earlier period.
Segment Details
In the reported quarter, revenues from Grocery Products marginally dipped 0.5% to $489.2 million.
Revenues at the Jennie-O Turkey Store segment dropped 10.4% to $484.9 million.
The company's Refrigerated Foods segment generated revenues of $1,166.7 million, down 5.7% year over year.
International & Other revenues were up 10.1% to nearly $155 million.
Specialty Foods revenues were down 9.2% to $196.8 million.
Margins/Costs: Hormel Foods' cost of sales was down 2.4% year over year to $1,981.1 million. Gross margin contracted 230 basis points (bps) to 20.5%. Selling, general and administrative expenses were $194.2 million, down from $244 million, recorded in the comparable time frame last year. The company's operating margin was 13.2% compared with 13.9% a year ago.
Gross margin for fiscal 2017 was 21.9%, down 80 bps year over year. While operating margin for the same time frame was 14%, up 10 bps year over year.
Balance Sheet/Cash Flow: Exiting the fiscal fourth quarter, Hormel Foods had cash and cash equivalents of $444.1 million, up from $415.1 million as of Oct 30, 2016. However, the company's long-term debt of $250 million (excluding current maturities) remained mostly unchanged.
For fiscal 2017, Hormel Foods generated cash of $1,010.2 million from operating activities, marginally up 1.7% year over year. Capital expenditures on purchase of property and plant totaled $217.3 million compared with $249.3 million incurred in the prior-year period.
In fiscal 2017, Hormel Foods paid dividends totaling $346 million compared to $296.5 million paid in fiscal 2016.
Outlook: Hormel Foods intends to boost near-term profitability on the back of its latest acquisitions and product launches. The company declared that it has merged its Specialty Foods segment with the Grocery Products segment for driving revenue growth and securing increased cost savings, going forward. However, the company perceives that its Jennie-O Turkey Store business segment will continue to face persistent challenges in the quarters ahead.
Based on the current fundamentals, Hormel Foods anticipates generating revenues in the range of $9.4-$9.8 billion for fiscal 2018. Earnings are anticipated to lie in the band of $1.60-$1.70 per share for the same period.
How Have Estimates Been Moving Since Then?
Following the release, investors have witnessed a downward trend in fresh estimates. There has been one revision lower for the current quarter.
Hormel Foods Corporation Price and Consensus
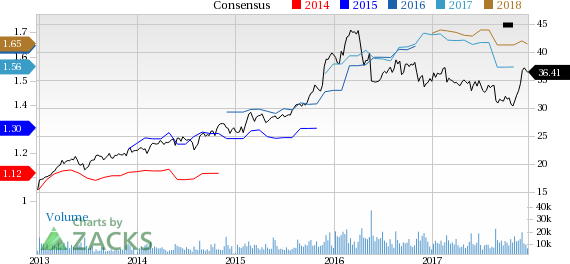
Hormel Foods Corporation Price and Consensus | Hormel Foods Corporation Quote
VGM Scores
At this time, Hormel Foods' stock has a nice Growth Score of B, though it is lagging a lot on the momentum front with a D. The stock was allocated a grade of C on the value side, putting it in the middle 20% for this investment strategy.
Overall, the stock has an aggregte VGM Score of B. If you aren't focused on one strategy, this score is the one you should be interested in.
Based on our scores, the stock is more suitable for growth investors than value investors.
Outlook
While estimates have been broadly trending downward for the stock, the magnitude of these revisions has been net zero. Notably, the stock has a Zacks Rank #3 (Hold). We expect in-line returns from the stock in the next few months.
Palantir remains highly valued with a 460x P/E ratio and a 42.5x P/B ratio, far above its peers. The stock's beta of 2.81 signals high volatility, meaning sharp moves in both...
The S&P 500 had started to clear resistance, posting new all-time highs before sellers struck with a vengeance. The selling was bad, similar to that seen in December, which...
Myself and others have highlighted how European Equities have been breaking out to new all-time highs on the back of bullish factors such as cheap valuations, monetary tailwinds,...
Are you sure you want to block %USER_NAME%?
By doing so, you and %USER_NAME% will not be able to see any of each other's Investing.com's posts.
%USER_NAME% was successfully added to your Block List
Since you’ve just unblocked this person, you must wait 48 hours before renewing the block.
I feel that this comment is:
Thank You!
Your report has been sent to our moderators for review
Add a Comment
We encourage you to use comments to engage with other users, share your perspective and ask questions of authors and each other. However, in order to maintain the high level of discourse we’ve all come to value and expect, please keep the following criteria in mind:
Enrich the conversation, don’t trash it.
Stay focused and on track. Only post material that’s relevant to the topic being discussed.
Be respectful. Even negative opinions can be framed positively and diplomatically. Avoid profanity, slander or personal attacks directed at an author or another user. Racism, sexism and other forms of discrimination will not be tolerated.
Perpetrators of spam or abuse will be deleted from the site and prohibited from future registration at Investing.com’s discretion.