


Sign up to create alerts for Instruments,
Economic Events and content by followed authors
Free Sign Up Already have an account? Sign In
Please try another search
Breaking News

A month has gone by since the last earnings report for Honeywell International Inc. (NYSE:HON) . Shares have lost about 4.2% in the past month, underperforming the market.
Will the recent negative trend continue leading up to its next earnings release, or is HON due for a breakout? Before we dive into how investors and analysts have reacted as of late, let's take a quick look at its most recent earnings report in order to get a better handle on the important drivers.
Honeywell Beats Q4 Earnings on Organic Growth, View Up
Honeywell International reported solid fourth-quarter 2017 results with healthy year-over-year increase in revenues and adjusted earnings. GAAP loss for the reported quarter was $2,411 million or loss of $3.18 a share as against net income of $1,034 million or $1.34 per share in the year-ago quarter. The significant decline in GAAP earnings was primarily attributable to a provisional charge of $3.8 billion to reflect the estimated impacts of the U.S. Tax Cuts and Jobs Act of 2017.
Excluding non-recurring items, adjusted earnings for the quarter were $1.85 per share compared with $1.74 in the year-earlier quarter. Adjusted earnings for the reported quarter beat the Zacks Consensus Estimate by a penny. For full year 2017, adjusted earnings were $7.11 per share compared with $6.46 in 2016.
Operational Details
Fourth-quarter 2017 revenues inched up 8.6% year over year to $10,843 million and exceeded the Zacks Consensus Estimate of $10,689 million. The top-line improvement was largely due to organic growth of 6%, driven by strength in Aerospace aftermarket, UOP, Advanced Materials, and Intelligrated. Total revenue for full year 2017 improved to $40,534 million from $39,302 million in 2016.
Total segment profit for the quarter was $2,096 million compared with $1,899 million in the prior-year period, with respective segment profit margins of 19.3% and 19%. Operating income increased to $1,716 million from $1,613 million in the year-ago quarter for respective margins of 15.8% and 16.2%.
Segment Details
Aerospace sales were $3,902 million in the reported quarter, up 6% year over year. Segment profit was up 21% to $893 million for margin improvement of 270 bps to 22.9%. Impressive growth was primarily driven by strength in the commercial aftermarket and U.S. defense, along with solid demand for light vehicle gas and commercial vehicle turbochargers in Transportation Systems.
Home and Building Technologies sales came in at $2,615 million, up 5% year over year. Segment profit was up 3% to $461 million although margin contracted 40 bps to 17.6% due to lower security volumes. The upside in revenues was driven by continued demand in fire and building products in Europe and robust growth in China.
Performance Materials and Technologies revenues were $2,854 million, up 12% year over year on healthy growth across all businesses. Segment profit was up 3% to $607 million although margin contracted 180 bps to 21.3% due to unplanned plant outage.
Safety and Productivity Solutions’ top-line was $1,472 million, up 14% year over year. Segment profit was up 25% to $231 million for margin improvement of 140 bps to 15.7%. The segment’s sales improved on the back of double-digit organic sales growth at Intelligrated, higher volumes in industrial safety products, sensing controls, and voice-enabled workflow solutions.
Balance Sheet and Cash Flow
Cash and cash equivalents at year-end 2017 were $7,059 million while long-term debt was $12,573 million compared with respective tallies of $7,843 million and $12,182 million in the year-ago period.
Net cash provided from operating activities for 2017 was $5,966 million compared with $5,498 million in 2016. Honeywell exited fourth-quarter 2017 with free cash flow of $1,754 million compared with $1,696 million in the year-ago quarter.
Outlook
Concurrent with the earnings release, Honeywell revised full-year 2018 earnings guidance to better reflect the favorable impact from the tax reform. The company currently anticipates earnings within the range of $7.75−$8.00 per share for 2018, up from earlier expectations of $7.55−$7.80, representing year-over-year growth of 9-13%, up from 6-10% expected earlier. However, revenue guidance is affirmed at $41.8-$42.5 billion.
How Have Estimates Been Moving Since Then?
In the past month, investors have witnessed an upward trend in fresh estimates. There have been three revisions higher for the current quarter, while looking back an additional 30 days, we can see even more upward momentum. There have been only two moves up in the last two months.
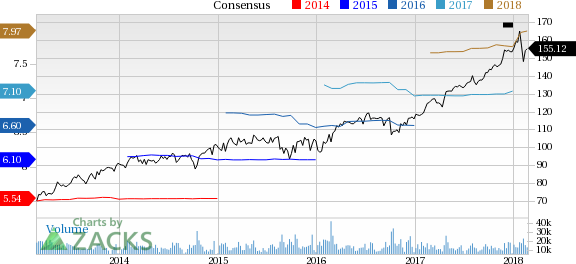
Honeywell International Inc. Price and Consensus | Honeywell International Inc. Quote
VGM Scores
At this time, HON has a nice Growth Score of B, though it is lagging a lot on the momentum front with a C. Following the exact same course, the stock was also allocated a grade of C on the value side, putting it in the middle 20% for this investment strategy.
Overall, the stock has an aggregate VGM Score of B. If you aren't focused on one strategy, this score is the one you should be interested in.
The company's stock is more suitable for growth than value and momentum investors based on our style scores.
Outlook
Estimates have been trending upward for the stock, and the magnitude of these revisions looks promising. Notably, HON has a Zacks Rank #3 (Hold). We expect an in-line return from the stock in the next few months.
Palantir remains highly valued with a 460x P/E ratio and a 42.5x P/B ratio, far above its peers. The stock's beta of 2.81 signals high volatility, meaning sharp moves in both...
The S&P 500 had started to clear resistance, posting new all-time highs before sellers struck with a vengeance. The selling was bad, similar to that seen in December, which...
Myself and others have highlighted how European Equities have been breaking out to new all-time highs on the back of bullish factors such as cheap valuations, monetary tailwinds,...
Are you sure you want to block %USER_NAME%?
By doing so, you and %USER_NAME% will not be able to see any of each other's Investing.com's posts.
%USER_NAME% was successfully added to your Block List
Since you’ve just unblocked this person, you must wait 48 hours before renewing the block.
I feel that this comment is:
Thank You!
Your report has been sent to our moderators for review
Add a Comment
We encourage you to use comments to engage with other users, share your perspective and ask questions of authors and each other. However, in order to maintain the high level of discourse we’ve all come to value and expect, please keep the following criteria in mind:
Enrich the conversation, don’t trash it.
Stay focused and on track. Only post material that’s relevant to the topic being discussed.
Be respectful. Even negative opinions can be framed positively and diplomatically. Avoid profanity, slander or personal attacks directed at an author or another user. Racism, sexism and other forms of discrimination will not be tolerated.
Perpetrators of spam or abuse will be deleted from the site and prohibited from future registration at Investing.com’s discretion.