🚀 ProPicks AI Hits +34.9% Return!Read Now

Gold Technicals

Published 03/14/2014, 03:00 AM
Updated 07/09/2023, 06:31 AM
 Gold Bull
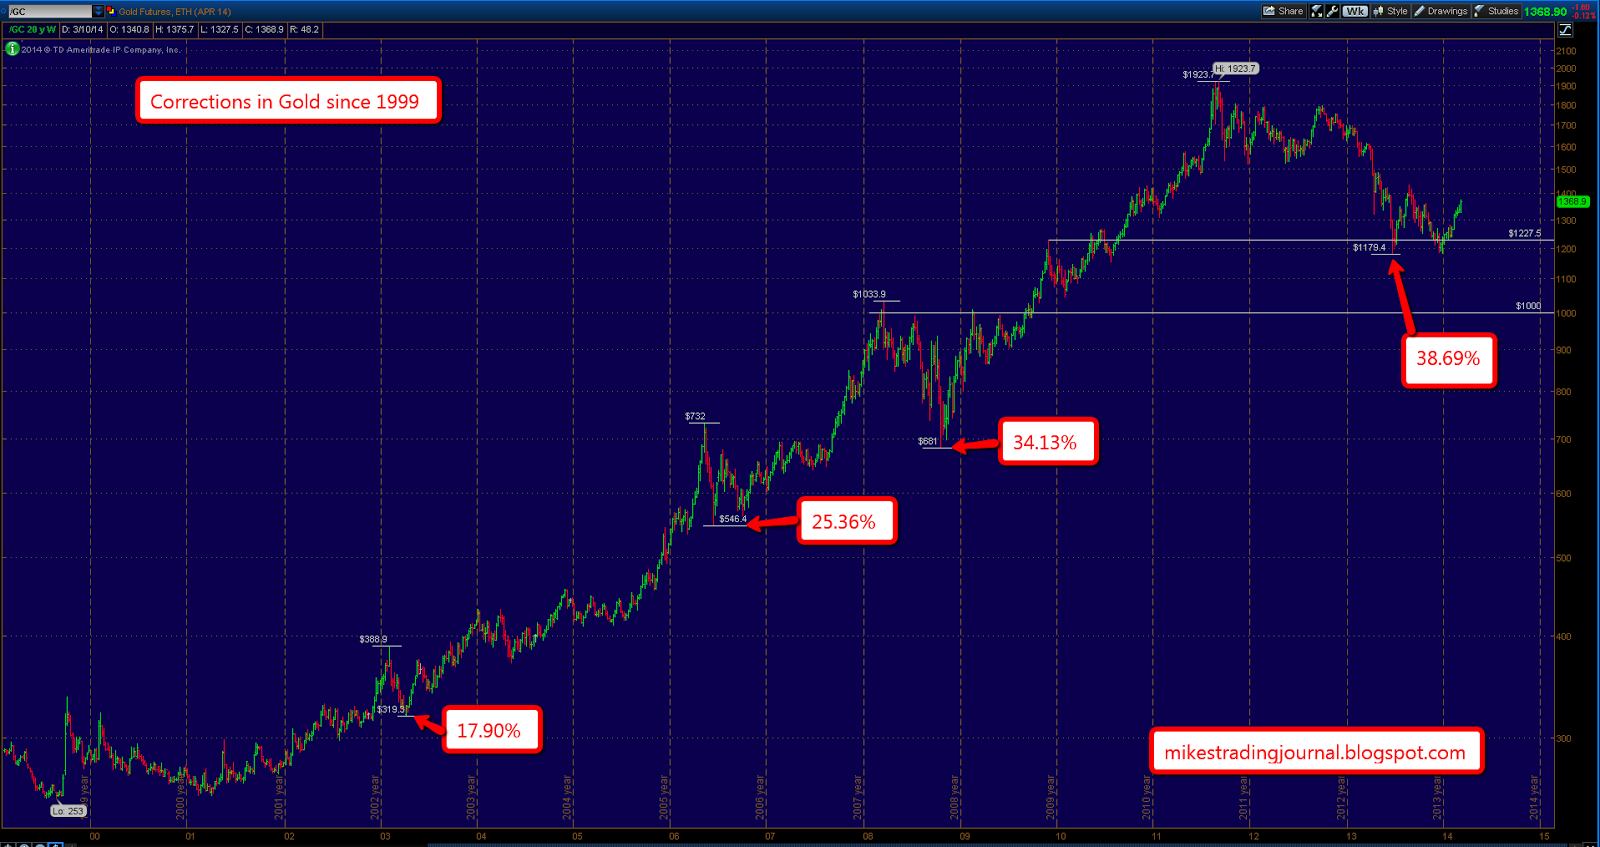
It's been awhile since I last created a post on Gold. The weekly chart above shows continuous spot future contract prices on Gold since the bull market began in 1999. I've highlighted the significant corrections inside, we can see this current correction is indeed the largest experienced since the 1999 bull market began.
 
However I don't see this as a tremendous problem because as you can see each correction has been bigger than it's predecessor the entire way up. And Gold continues to trade above it's midpoint of this long term bull market.
Gold ST
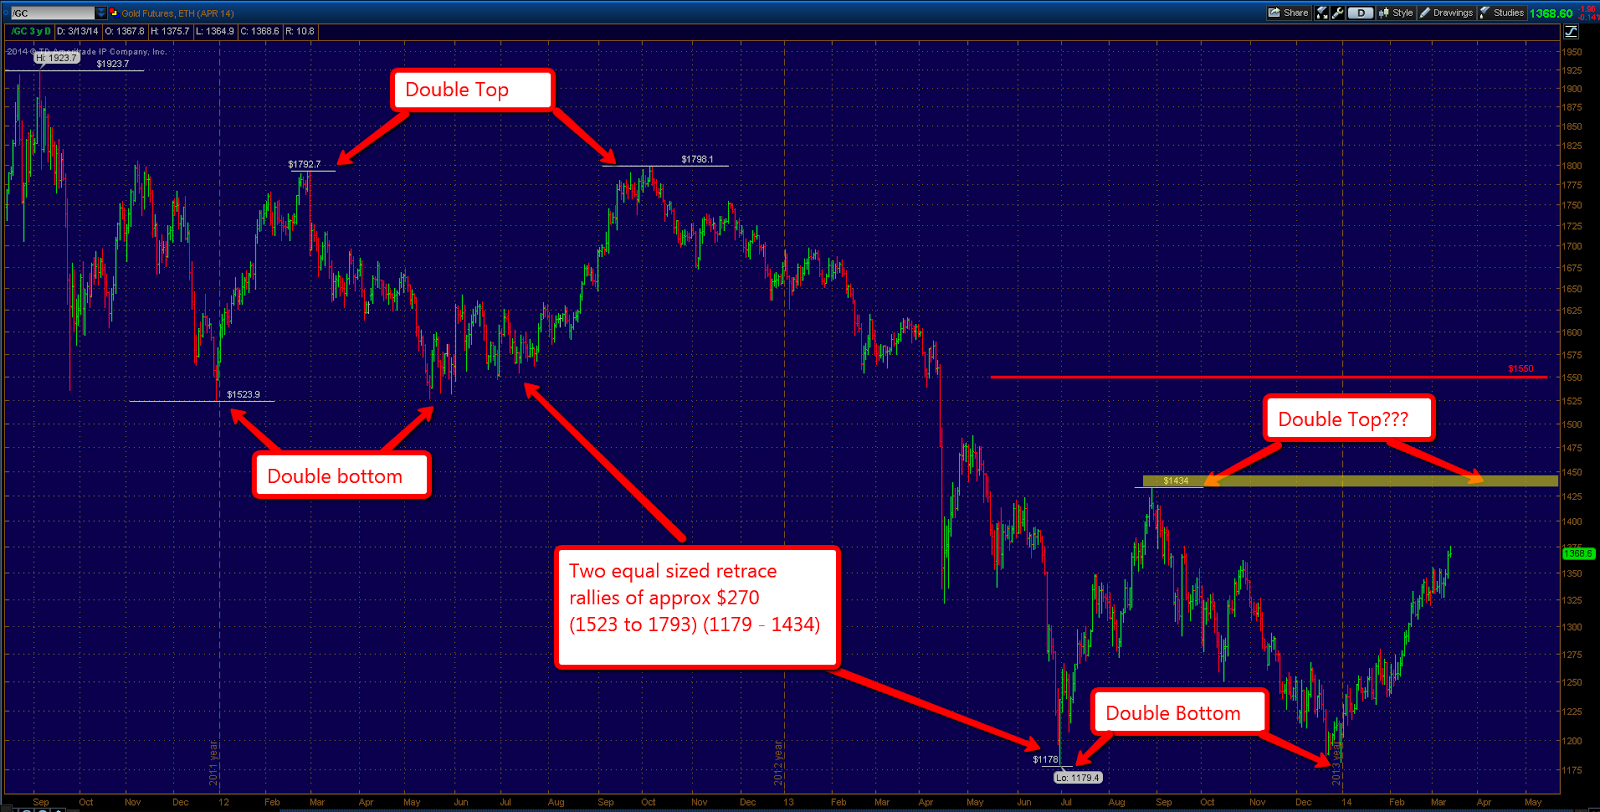
A closer look at this current correction reveals two very similar trading ranges. A double bottom at $1524 resulted in a double top in the $1790 range, the low of this range was breached last year in a couple of days of heavy selling.


We now find ourselves in a similar situation as Gold has come off a double bottom low at $1180 and looks poised to head back up into it's previous swing high at $1434. Will this create another double top situation that becomes the catalyst to send prices further down below $1180? It's hard to tell at this point, the main thing is to pay attention to the important pivots.

Taking out $1434 to the upside would make a high probability of trading at least as high as $1550 which happens to be the midpoint of this current correction and also the breakaway gap left behind when Gold tumbled last year. This is likely to be an important level and it's also possible that the energy created by this trading range could help propel prices much higher on a breakout.
Gold Histrorical
Of course we do have to talk about the other side of the coin. If Gold where to fall below it's double bottom at $1180 that would obviously be very bearish. The very first chart above I've highlighted the multiple highs Gold left behind in 2008 when it created it's inverted head and shoulders pattern before it really took off into the year 2011. That price level is around the $1000 level and it also about marks the midpoint of this entire bull market.
 
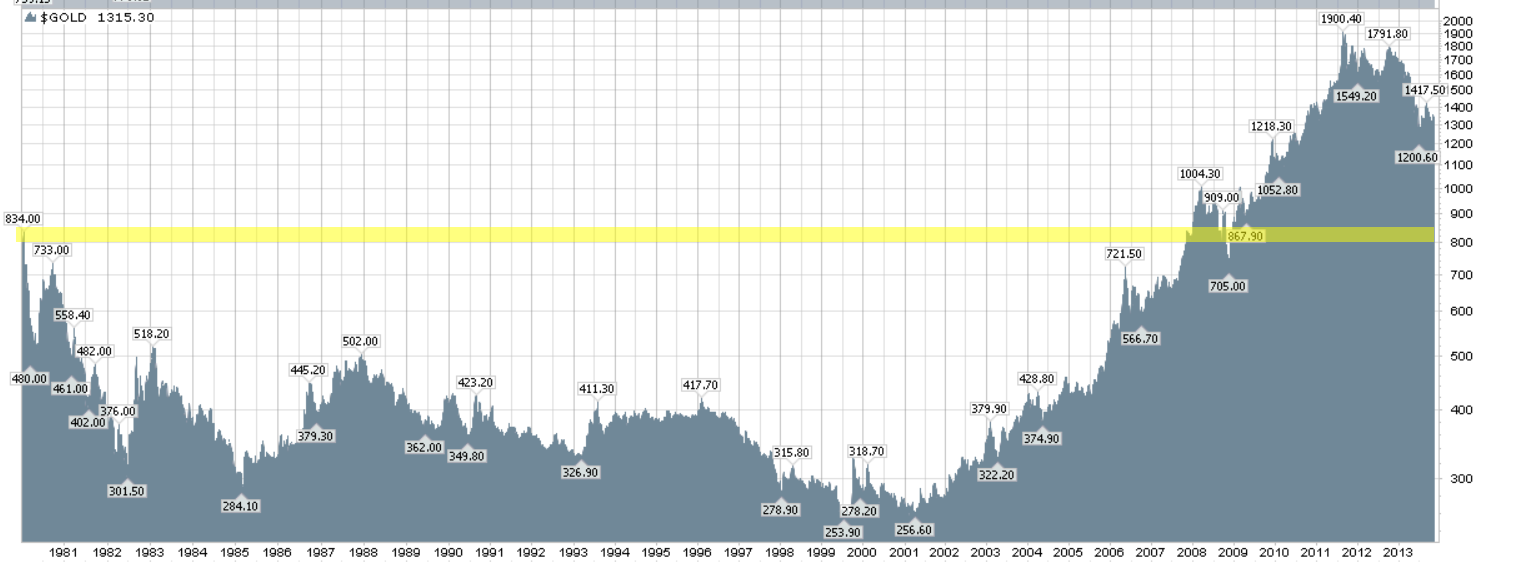
I would estimate that would be the minimum downside target in this scenario. I would estimate the higher probability downside would come in around $840 which I have depicted on this historical chart above. This happens to be the high of the last major bull market in Gold that ended in the year 1980.
S&P 500
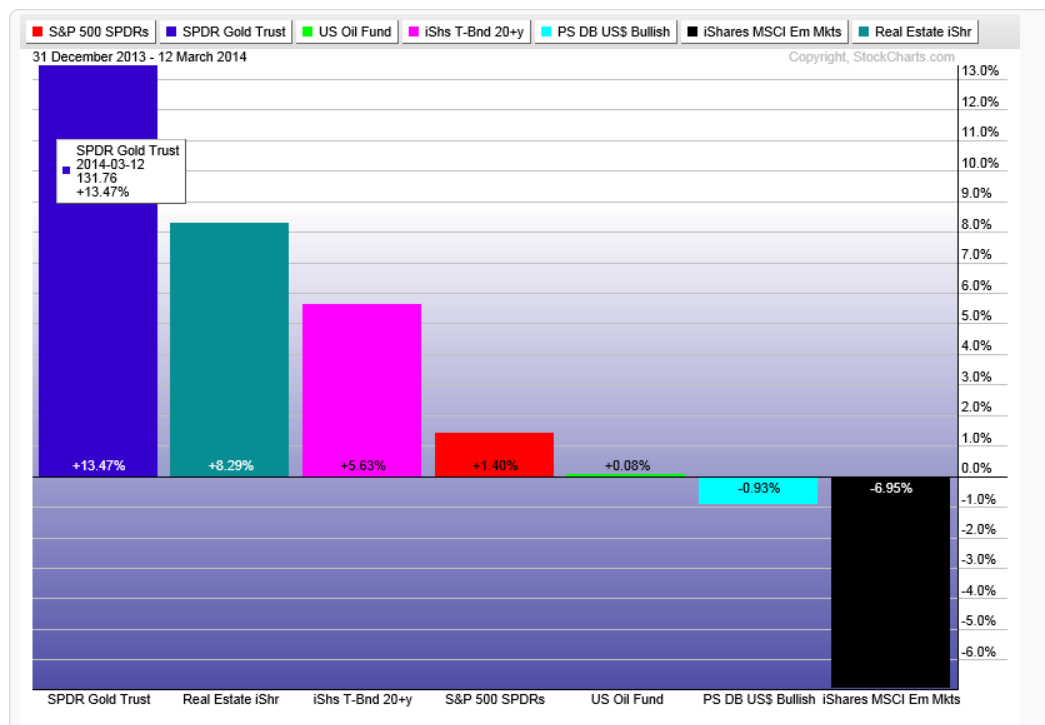
It's difficult to predict the exact course of Gold prices will take (or any investment vehicle for that matter). What we can't deny is the relative strength this asset class has experienced year to date. As the chart above shows, Gold (GLD) has a year to date gain of over 13% while the S+P 500 struggles to stay above it's flat line. And it happens to be the best performing asset class of the ones that I follow closely.
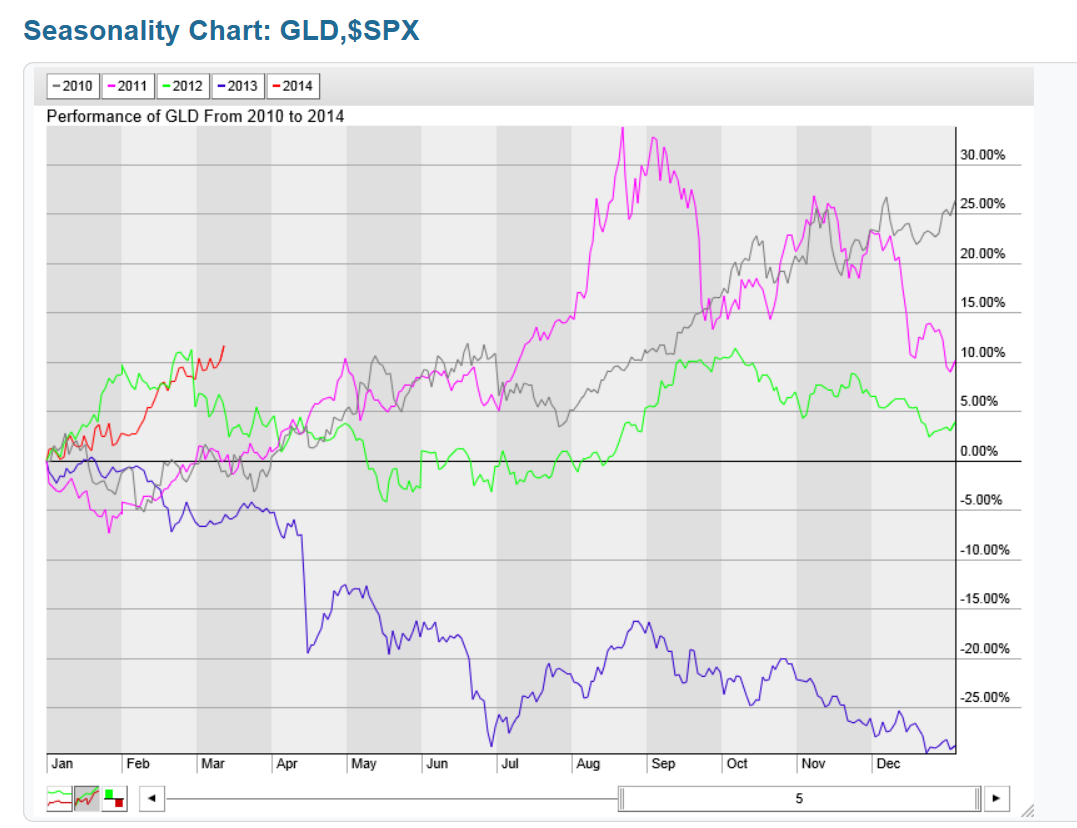
Gold - SPX
However even that performance is not entirely foolproof, a small sample size but in the last 5 years the last time Gold started the year off this well in 2012 it remained relatively subdued the remainder of the year.
 
Disclaimer : This website was created for entertainment and educational purposes only. Any opinions and analysis expressed anywhere on this site are for educational and entertainment purposes only, and ARE NOT guaranteed in any way. In no event shall Mikes Trading Journal and everyone involved, have any liability for any losses incurred in connection with any decision made, whether action or inaction, upon the information provided on this web site.

Latest comments

Loading next article…
Risk Disclosure: Trading in financial instruments and/or cryptocurrencies involves high risks including the risk of losing some, or all, of your investment amount, and may not be suitable for all investors. Prices of cryptocurrencies are extremely volatile and may be affected by external factors such as financial, regulatory or political events. Trading on margin increases the financial risks.
Before deciding to trade in financial instrument or cryptocurrencies you should be fully informed of the risks and costs associated with trading the financial markets, carefully consider your investment objectives, level of experience, and risk appetite, and seek professional advice where needed.
Fusion Media would like to remind you that the data contained in this website is not necessarily real-time nor accurate. The data and prices on the website are not necessarily provided by any market or exchange, but may be provided by market makers, and so prices may not be accurate and may differ from the actual price at any given market, meaning prices are indicative and not appropriate for trading purposes. Fusion Media and any provider of the data contained in this website will not accept liability for any loss or damage as a result of your trading, or your reliance on the information contained within this website.
It is prohibited to use, store, reproduce, display, modify, transmit or distribute the data contained in this website without the explicit prior written permission of Fusion Media and/or the data provider. All intellectual property rights are reserved by the providers and/or the exchange providing the data contained in this website.
Fusion Media may be compensated by the advertisers that appear on the website, based on your interaction with the advertisements or advertisers.
© 2007-2024 - Fusion Media Limited. All Rights Reserved.