NVDA gained a massive 197% since our AI first added it in November - is it time to sell? 🤔Read more

Gold Hits New Four-Month High

Published 03/03/2014, 11:40 PM
Updated 01/01/2017, 02:20 AM
GC
-

Gold (daily chart) established a new four-month high at 1350 early on Monday, slightly surpassing last week’s 1345 high, in a continuing rally that extends back to the end of 2013. Since the 1178 low on the very last day of 2013, the precious metal has rebounded and advanced sharply to rise above key technical price levels. Mid-February saw gold rally well above its 200-day moving average, a situation that has not occurred since a year earlier in February of 2013.

With the clear double-bottom pattern around 1180 in June and December, the price of gold has recently shown significant indications of a potential bottoming out. Having just emerged above the major downtrend resistance line that has defined the bearish trend since the 1800-area high in October of 2012, the price continues to show marked bullish momentum. In the event of further bullish momentum after the breakout above the noted trend line, a key upside resistance target resides around the 1425 level, last hit in August, which represents the peak of the noted double-bottom pattern.
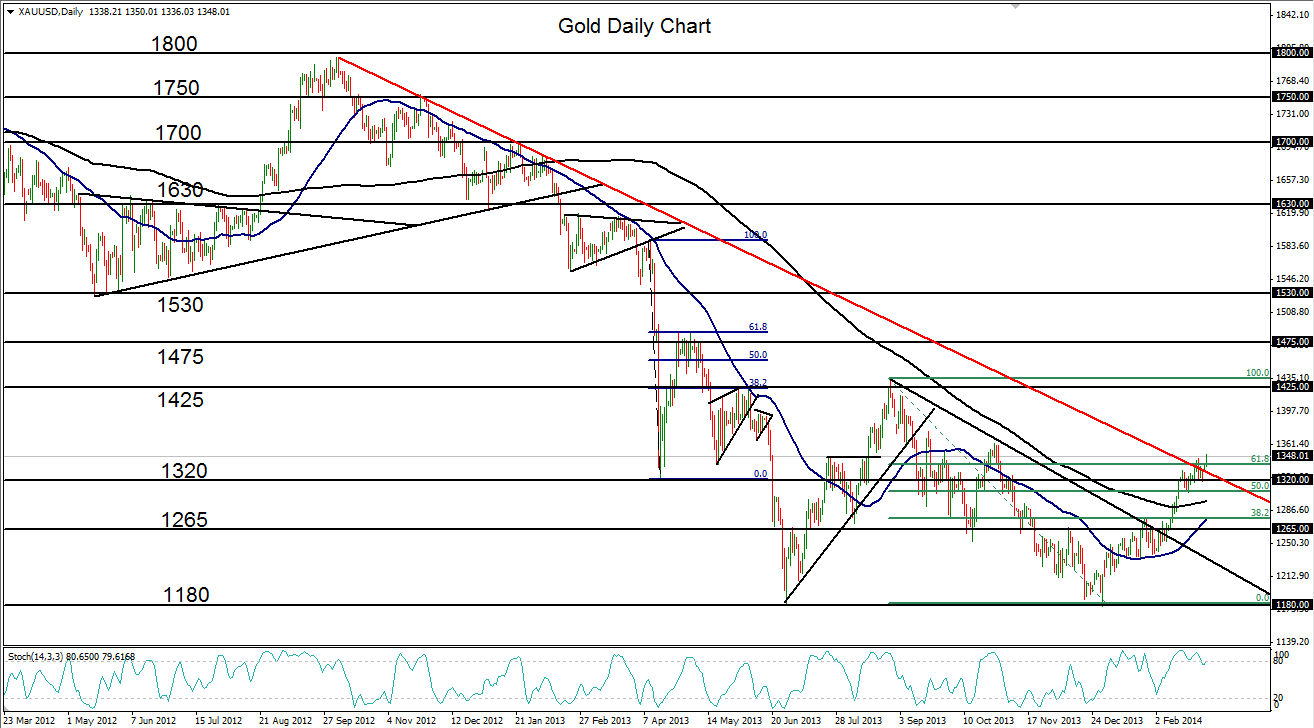
Gold Daily Chart

Disclosure: FX Solutions assumes no responsibility for errors, inaccuracies or omissions in these materials. FX Solutions does not warrant the accuracy or completeness of the information, text, graphics, links or other items contained within these materials. FX Solutions shall not be liable for any special, indirect, incidental, or consequential damages, including without limitation losses, lost revenues, or lost profits that may result from these materials.

The products offered by FX Solutions are leveraged products which carry a high level of risk to your capital with the possibility of losing more than your initial investment and may not be suitable for all investors. Ensure you fully understand the risks involved and seek independent advice if necessary.

Latest comments

Loading next article…
Risk Disclosure: Trading in financial instruments and/or cryptocurrencies involves high risks including the risk of losing some, or all, of your investment amount, and may not be suitable for all investors. Prices of cryptocurrencies are extremely volatile and may be affected by external factors such as financial, regulatory or political events. Trading on margin increases the financial risks.
Before deciding to trade in financial instrument or cryptocurrencies you should be fully informed of the risks and costs associated with trading the financial markets, carefully consider your investment objectives, level of experience, and risk appetite, and seek professional advice where needed.
Fusion Media would like to remind you that the data contained in this website is not necessarily real-time nor accurate. The data and prices on the website are not necessarily provided by any market or exchange, but may be provided by market makers, and so prices may not be accurate and may differ from the actual price at any given market, meaning prices are indicative and not appropriate for trading purposes. Fusion Media and any provider of the data contained in this website will not accept liability for any loss or damage as a result of your trading, or your reliance on the information contained within this website.
It is prohibited to use, store, reproduce, display, modify, transmit or distribute the data contained in this website without the explicit prior written permission of Fusion Media and/or the data provider. All intellectual property rights are reserved by the providers and/or the exchange providing the data contained in this website.
Fusion Media may be compensated by the advertisers that appear on the website, based on your interaction with the advertisements or advertisers.
© 2007-2024 - Fusion Media Limited. All Rights Reserved.