
Larry Summers withdrew his candidacy for Fed Chairman over the weekend, making it more likely that Fed Vice Chair Janet Yellen will be appointed. She is known to favour the current quantitative easing system and to be more concerned nowadays with growth rather than inflation, whereas Summers, the former front-runner, was thought to be more in favour of cutting back on the QE program (if indeed his views on the topic were known at all). Thus the market believes interest rates will remain lower for longer under Yellen than they would have under Summers. The news of his withdrawal has sent US interest rates sharply lower, with the implied rate on the June 2015 Fed Funds future (the farthest one that actually traded so far) falling by 10 bps and the yield on the 10-year Treasury bond futures also falling by 10 bps (after a 7 bps drop in the cash market on Friday). S&P 500 stock futures were up 1.1%. Naturally with US interest rate expectations changing so much, the dollar was lower against almost all the major currencies (except NOK).
Personally I think this may be overdone as concerns the near-term, because the Fed seems to be on its way to begin tapering with even the resident doves on board. (We’ll know more about that later this week.) However, it’s true that when it comes time to begin raising short rates, which will come eventually, Yellen may be more willing to err on the side of caution than Summers would have been. In that respect the change may further the shift in outlook on relative monetary policy that we’ve been seeing. For some time the dollar story was one of divergence: US monetary policy alone in the G10 shifting towards tightening, whereas the other central banks were either neutral or still retained an easing bias. Now with New Zealand already adopting a tightening bias, Norway poised to do so later this week (maybe), and the market already pricing in such a change in the UK, this policy divergence has changed into policy convergence. That is not likely to produce as strong a dollar as we were expecting before. The change is particularly evident this morning in the EM currencies, which have generally strengthened vs USD.
The schedule today begins with the final figure for the Eurozone CPI for August. The preliminary figure was +0.1% m/m. In the US, industrial production for August is expected to rise 0.4% mom vs a flat figure the previous month, with capacity utilization in August forecast to rise slightly by 0.1 to 77.9. The Empire state manufacturing survey for September is expected to rise slightly to 9.00 from 8.25. These generally strong figures for the US could help to spark a dollar rebound in US trading. For the week as a whole, the focus will of course be on the FOMC decision Wednesday on whether to begin “tapering off” its monthly bond purchases. The Swiss National Bank and the Norges Bank will also have monetary policy meetings on Thursday; no rate changes are expected at these policy meetings, but there is some debate about what adjustment Norges Bank will make to its expected rate path after its recent higher-than-expected inflation figures and weaker-than-expected regional survey. The Reserve Bank of Australia will release its meeting minutes on Tuesday. For the UK, the focus will be on Tuesday’s retail sales, CPI and PPI with the BoE’s minutes coming out on Wednesday. The eurozone consumer confidence will be released on Friday. In the US, CPI and the Treasury capital flows data come on Tuesday and the Phili Fed index on Thursday.
There is a lot of housing data out this week from the US: NAHB housing market index on Tuesday, housing starts and building permits on Wednesday, and existing home sales on Thursday. Strong data there could shore up the dollar. Bank of Canada will release CPI data on Friday.
The Market:
EUR/USD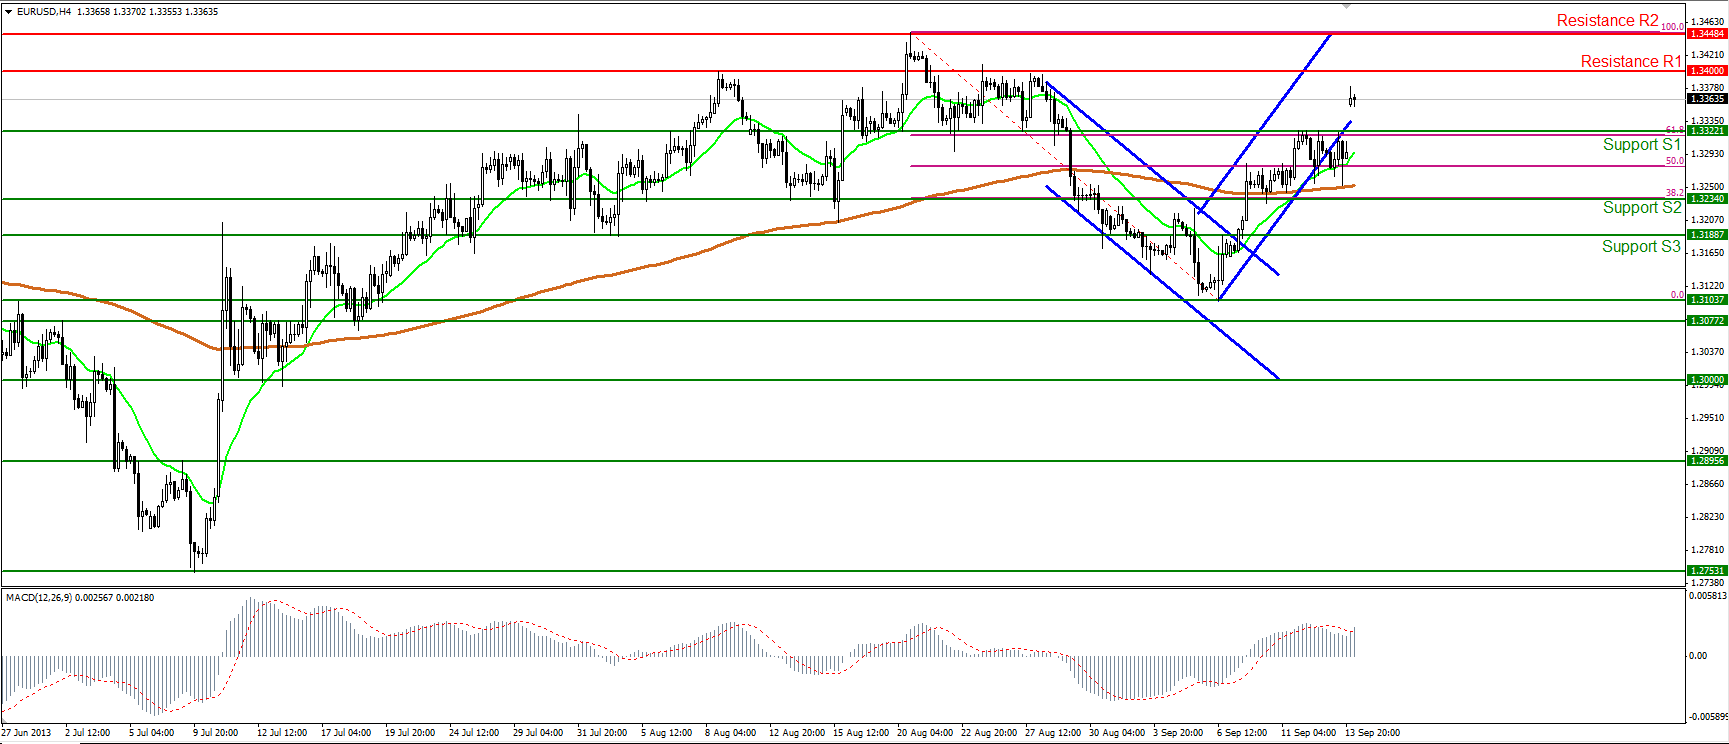 EUR/USD" title="EUR/USD" width="1729" height="744">
The EUR/USD opened the European session with a bullish gap, breaking above the 1.3322 level, which coincides with the 61.8% Fibonacci retracement level of the 20th August- 6th September downward move. Currently the pair is lying between the 1.3322 (S1) support and the psychological round number of 1.3400 (R1), where a clear upside break should target the next resistance levels of 1.3448 (R2) and 1.3517 (R3) respectively. The MACD oscillator, which was already in bullish territory, has just achieved a cross above its trigger line, completing the bullish picture of the price action.
Support: Support is found at the 1.3322 (S1) level, followed by 1.3234 (S2) and 1.3188 (S3)
Resistance: Resistance levels are the psychological number of 1.3400 (R1) (61.8%), followed by 1.3448 (R2) and 1.3517 (R3) (daily chart)
EUR/JPY
EUR/JPY declined during Friday’s session, but after today’s opening managed to find support at 131.70 (S1) and moved slightly higher. If the pair continues heading towards the resistance of 132.63 (R1) and breaks above it, bullish extensions should be triggered towards the 133.35 (R2) and 133.74 (R3) resistance levels. On the other hand, a break below the 131.70 (S1) support (also 50% Fibonacci retracement of the previous upward wave) should target the next support at 130.96 (S2). Both the RSI and MACD oscillators lie at their equilibrium levels, thus giving little indicator of which way the rate might go.
Support: Support levels are at 131.70 (S1), followed by 130.96 (S2) and the 130.51(S3).
Resistance: Resistance is identified 132.63 (R1), followed by 133.35 (R2) and 133.74 (R3), the latter one found from the daily chart.
GBP/USD
The GBP/USD also opened the session with a gap to the upside and breaking above the 1.5892 resistance level (current support). The pair is now heading towards the psychological level of 1.6000 (R1), where I expect the price to find strong resistance. If the bulls are strong enough to overcome that hurdle, they are likely to drive the battle towards the 1.6080 (R2) and 1.6173 (R3) resistance levels. The MACD oscillator, already in positive territory, achieved a bullish cross above its trigger line, confirming the bullish picture of the pair.
Support: Support levels are identified at 1.5892 (S1), 1.5840 (S2) and 1.5716 (S3) respectively.
Resistance: Resistance is found at the psychological level of 1.6000 (R1), 1.6080 (R2) and 1.6173 (R3), the latter two found from the daily chart.
Gold
Gold found support at the 1305 level, which coincides with the 50% retracement level of the 28th June - 28th August upward move, and moved higher. At the time of writing the yellow metal lies between the 1320 (S1) and 1347 (R1) levels and if buying pressure continues pushing the price higher, a break above the 1347 (R1) is probable, targeting the next resistance of 1376 (R2). The MACD oscillator reading is below zero but above its trigger, showing weakness for the price to continue its downward path.
Support: Support levels are at 1320 (S1), followed by 1305(S2) and 1271 (S3).
Resistance: Resistance is identified at the 1347 (R1) level, followed by 1376 (R2) and 1394 (R3).
Oil
WTI moved lower after finding resistance once more at the upper boundary of the sideways range. Currently the price lies between the 106.71 (S1) and 108.85 (R1) levels. Still, both the RSI and the MACD lie near their neutral levels, confirming the indecisiveness between WTI investors.
Support: Support levels are at 106.71 (S1), 105.23 (S2) and 103.44 (S3).
Resistance: Resistance levels are at 108.85 (R1), followed by 110.58 (R2) and 112.14 (R3).
BENCHMARK CURRENCY RATES - DAILY GAINERS AND LOSERS
MARKETS SUMMARY
- English (UK)
- English (India)
- English (Canada)
- English (Australia)
- English (South Africa)
- English (Philippines)
- English (Nigeria)
- Deutsch
- Español (España)
- Español (México)
- Français
- Italiano
- Nederlands
- Português (Portugal)
- Polski
- Português (Brasil)
- Русский
- Türkçe
- العربية
- Ελληνικά
- Svenska
- Suomi
- עברית
- 日本語
- 한국어
- 简体中文
- 繁體中文
- Bahasa Indonesia
- Bahasa Melayu
- ไทย
- Tiếng Việt
- हिंदी
Daily Commentary: September 16, 2013
Published 09/16/2013, 04:57 AM
Updated 07/09/2023, 06:31 AM
Daily Commentary: September 16, 2013
Summers’ lease hath all too short a date:
Latest comments
Loading next article…
Install Our App
Risk Disclosure: Trading in financial instruments and/or cryptocurrencies involves high risks including the risk of losing some, or all, of your investment amount, and may not be suitable for all investors. Prices of cryptocurrencies are extremely volatile and may be affected by external factors such as financial, regulatory or political events. Trading on margin increases the financial risks.
Before deciding to trade in financial instrument or cryptocurrencies you should be fully informed of the risks and costs associated with trading the financial markets, carefully consider your investment objectives, level of experience, and risk appetite, and seek professional advice where needed.
Fusion Media would like to remind you that the data contained in this website is not necessarily real-time nor accurate. The data and prices on the website are not necessarily provided by any market or exchange, but may be provided by market makers, and so prices may not be accurate and may differ from the actual price at any given market, meaning prices are indicative and not appropriate for trading purposes. Fusion Media and any provider of the data contained in this website will not accept liability for any loss or damage as a result of your trading, or your reliance on the information contained within this website.
It is prohibited to use, store, reproduce, display, modify, transmit or distribute the data contained in this website without the explicit prior written permission of Fusion Media and/or the data provider. All intellectual property rights are reserved by the providers and/or the exchange providing the data contained in this website.
Fusion Media may be compensated by the advertisers that appear on the website, based on your interaction with the advertisements or advertisers.
© 2007-2024 - Fusion Media Limited. All Rights Reserved.