


Sign up to create alerts for Instruments,
Economic Events and content by followed authors
Free Sign Up Already have an account? Sign In
Please try another search

CME Group Inc. (NASDAQ:CME) reported fourth-quarter 2017 adjusted earnings per share of $1.12, beating the Zacks Consensus Estimate of $1.10. The bottom line, however, deteriorated 1.8% year over year.
CME Group Inc. Price, Consensus and EPS Surprise
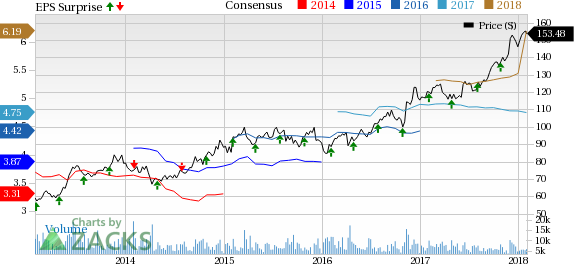
CME Group Inc. Price, Consensus and EPS Surprise | CME Group Inc. Quote
The year-over-year decline was mainly due to lower trading volumes as well as revenues. Nonetheless, options business remained sturdy in the quarter.
Notably, the company achieved its primary goals of expansion of global customer base, innovation across its diverse product set and operational efficiency in 2017. Apart from enhancing shareholders’ value, the company was able to keep its expenses relatively flat for the third straight year.
Further, CME Group successfully launched products and saw growth in Europe and Asia outperform the level in the United States.
Including a tax benefit due to recognition of a reduction in deferred tax liabilities as a result of the Tax Cut and Jobs Act of 2017, net income was $8.63 per share, which skyrocketed 684.5% year over year.
Full-Year Highlights
For 2017, CME Group reported adjusted earnings per share of $4.77, beating the Zacks Consensus Estimate by 0.4% and improving 5.3% year over year.
Total revenues of $3.6 billion grew 1.4% year over year.
Performance in Detail
CME Group’s revenues of $900 million decreased 1.4% year over year. However, the top line beat the Zacks Consensus Estimate of $884 million by 1.8%. Decline in revenues can be attributable to lower clearing and transaction fees (down 1.3% year over year) and “other” (down nearly 33.5%).
Total expenses decreased 2.7% year over year to $362.7 million during the reported quarter, attributable to lower compensation and benefits, communications, professional fees and outside services, amortization of purchased intangibles as well as depreciation and amortization.
Operating income dipped 0.5% to $537.3 million from the prior-year quarter.
Average daily volume (ADV) declined 2.5% year over year to 15.9 million contracts due to lower volumes across three of the six product lines. Average rate per contract increased in only two of the six product lines.
Financial Update
As of Dec 31, 2017, CME Group had $2.0 billion of cash and marketable securities, up 2.1% from the 2016-end. As of Dec 31, 2017, long-term debt of $2.2 billion inched up 0.1% from the figure at year-end 2016.
As of Dec 31, 2017, the company had total assets worth $75.8 billion, up 9.3% from $69.4 billion at year-end 2016.
During 2017, the company approved dividends worth $2.1 billion including the annual variable dividend of $1.2 billion, paid in January 2018.
Zacks Rank
CME Group holds a Zacks Rank #2 (Buy). You can see the complete list of today’s Zacks #1 Rank (Strong Buy) stocks here.
Performance of Other Companies in Securities Exchange Industry
The bottom line of Nasdaq, Inc. (NASDAQ:NDAQ) and MarketAxess Holdings Inc. (NASDAQ:MKTX) beat the respective Zacks Consensus Estimate in the quarter under review.
Intercontinental Exchange, Inc. (NYSE:ICE) will report fourth-quarter results on Feb 7 before the market opens. The Zacks Consensus Estimate for earnings in the period is pegged at 72 cents, up 1.4% year over year.
Wall Street’s Next Amazon (NASDAQ:AMZN)
Zacks EVP Kevin Matras believes this familiar stock has only just begun its climb to become one of the greatest investments of all time. It’s a once-in-a-generation opportunity to invest in pure genius.
The fortune of Nvidia (NASDAQ:NVDA) is closely tied to Big Tech hyperscalers. Although the AI/GPU designer didn’t name its largest clients in the latest 10-K filing on Wednesday,...
Home improvement retailers Lowe’s (NYSE:LOW) and Home Depot (NYSE:HD) turned a corner, and their Q4 2024 earnings reports confirmed it. The corner is a return to comparable store...
One of our old flames, a former Contrarian Income Portfolio holding, has pulled back sharply in recent weeks. Time to buy the dip in this 4.3% dividend? Let’s discuss. Kinder...
Are you sure you want to block %USER_NAME%?
By doing so, you and %USER_NAME% will not be able to see any of each other's Investing.com's posts.
%USER_NAME% was successfully added to your Block List
Since you’ve just unblocked this person, you must wait 48 hours before renewing the block.
I feel that this comment is:
Thank You!
Your report has been sent to our moderators for review
Add a Comment
We encourage you to use comments to engage with other users, share your perspective and ask questions of authors and each other. However, in order to maintain the high level of discourse we’ve all come to value and expect, please keep the following criteria in mind:
Enrich the conversation, don’t trash it.
Stay focused and on track. Only post material that’s relevant to the topic being discussed.
Be respectful. Even negative opinions can be framed positively and diplomatically. Avoid profanity, slander or personal attacks directed at an author or another user. Racism, sexism and other forms of discrimination will not be tolerated.
Perpetrators of spam or abuse will be deleted from the site and prohibited from future registration at Investing.com’s discretion.