


Sign up to create alerts for Instruments,
Economic Events and content by followed authors
Free Sign Up Already have an account? Sign In
Please try another search

Cigna Corp. (NYSE:CI) came up with adjusted earnings per share of $1.94 for the fourth quarter, beating the Zacks Consensus Estimate of $1.87. Earnings also grew 3.7% year over year.
Better-than-expected earnings were primarily driven by strong contribution from its Global Supplemental Benefits segment.
Other Details
Cigna posted revenues of $10.53 billion, which surpassed the Zacks Consensus Estimate of $10.29 billion. Revenues grew 5.9% year over year.
Premiums were up 7% year over year to $8.2 billion, while fees increased 5% to $1.19 billion.
Total benefits and expenses of $9.78 billion increased 5% year over year, led by higher global health care medical cost.
The company’s medical enrollment grew to 15.91 million from 15.19 million in the year-ago quarter, driven by growth in its Commercial Mrket segment.
Cigna Corporation Price, Consensus and EPS Surprise
Strong Segment Performance
Global Health Care: Operating revenues of $8.3 billion were up 6% year over year on a 6.8% year-over-year increase in premiums and fees to $7.3 billion. The improvement was driven by customer growth in the Commercial Market segment. However, the upside was partially offset by reductions in Government customers.
Adjusted operating earnings were $397 million, down 2% year over year due to higher medical costs.
Global Supplemental Benefits: Operating revenues of $1.02 billion were up 17% year over year on a 17.2% increase in premiums and fees, reflecting continued business growth.
Adjusted operating income increased 28.5% year over year to $81 million, reflecting business growth and favorable claims experience, particularly in South Korea.
Global Disability and Life: Operating revenues of $1.1 billion were down 1% year over year due to a 1.4% decrease in premiums and fees.
Adjusted operating income declined 11.6% year over year to $61 million.
Financial Position
Cigna’s cash and marketable investments were of $1.2 billion as of Dec 31, 2017, down from $2.8 billion as of Dec 31, 2016.
Long-term debt was $5.2 billion as of Dec 31, 2017, reflecting a 9.3% increase year over year.
2018 Guidance
The company expects to earn in the range of $12.40 and $12.90, on a per share basis. Total revenue growth is projected in the range of 7% to 8% and medical customers are projected to grow by 0.3 million to 0.5 million lives.
The consolidated adjusted tax rate should fall in the range of 22.5% to 23.5%.
Zacks Rank and Other Releases
Cigna carries a Zacks Rank #1 (Strong Buy). You can see the complete list of today’s Zacks #1 Rank stocks here.
Other health insurers UnitedHealth Group Inc. (NYSE:UNH) , Anthem Inc. (NYSE:ANTM) and Aetna Inc. (NYSE:AET) beat estimates in the fourth quarter by 3.6%, 3.2% and 5.93%, respectively.
Wall Street’s Next Amazon (NASDAQ:AMZN)
Zacks EVP Kevin Matras believes this familiar stock has only just begun its climb to become one of the greatest investments of all time. It’s a once-in-a-generation opportunity to invest in pure genius.
The fortune of Nvidia (NASDAQ:NVDA) is closely tied to Big Tech hyperscalers. Although the AI/GPU designer didn’t name its largest clients in the latest 10-K filing on Wednesday,...
Home improvement retailers Lowe’s (NYSE:LOW) and Home Depot (NYSE:HD) turned a corner, and their Q4 2024 earnings reports confirmed it. The corner is a return to comparable store...
One of our old flames, a former Contrarian Income Portfolio holding, has pulled back sharply in recent weeks. Time to buy the dip in this 4.3% dividend? Let’s discuss. Kinder...
Are you sure you want to block %USER_NAME%?
By doing so, you and %USER_NAME% will not be able to see any of each other's Investing.com's posts.
%USER_NAME% was successfully added to your Block List
Since you’ve just unblocked this person, you must wait 48 hours before renewing the block.
I feel that this comment is:
Thank You!
Your report has been sent to our moderators for review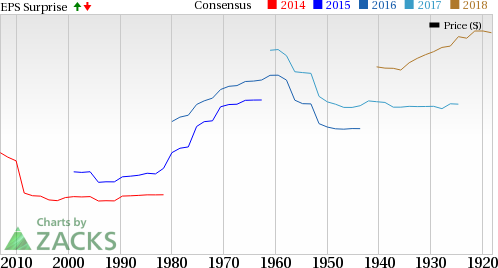

Add a Comment
We encourage you to use comments to engage with other users, share your perspective and ask questions of authors and each other. However, in order to maintain the high level of discourse we’ve all come to value and expect, please keep the following criteria in mind:
Enrich the conversation, don’t trash it.
Stay focused and on track. Only post material that’s relevant to the topic being discussed.
Be respectful. Even negative opinions can be framed positively and diplomatically. Avoid profanity, slander or personal attacks directed at an author or another user. Racism, sexism and other forms of discrimination will not be tolerated.
Perpetrators of spam or abuse will be deleted from the site and prohibited from future registration at Investing.com’s discretion.