- All Instrument Types
- Indices
- Equities
- ETFs
- Funds
- Commodities
- Currencies
- Crypto
- Bonds
- Certificates
Please try another search

China’s Trade Slumps

Imports worse than forecast
China’s trade data for September showed imports contracting 8.5% y/y while exports declined a lesser 3.2%. Imports were much worse than economists’ expectations (-5.2%) but exports were only slightly worse (-3.0). As a result of the sharp drop in imports, the trade surplus widened to $39.65 billion from $34.83 billion.
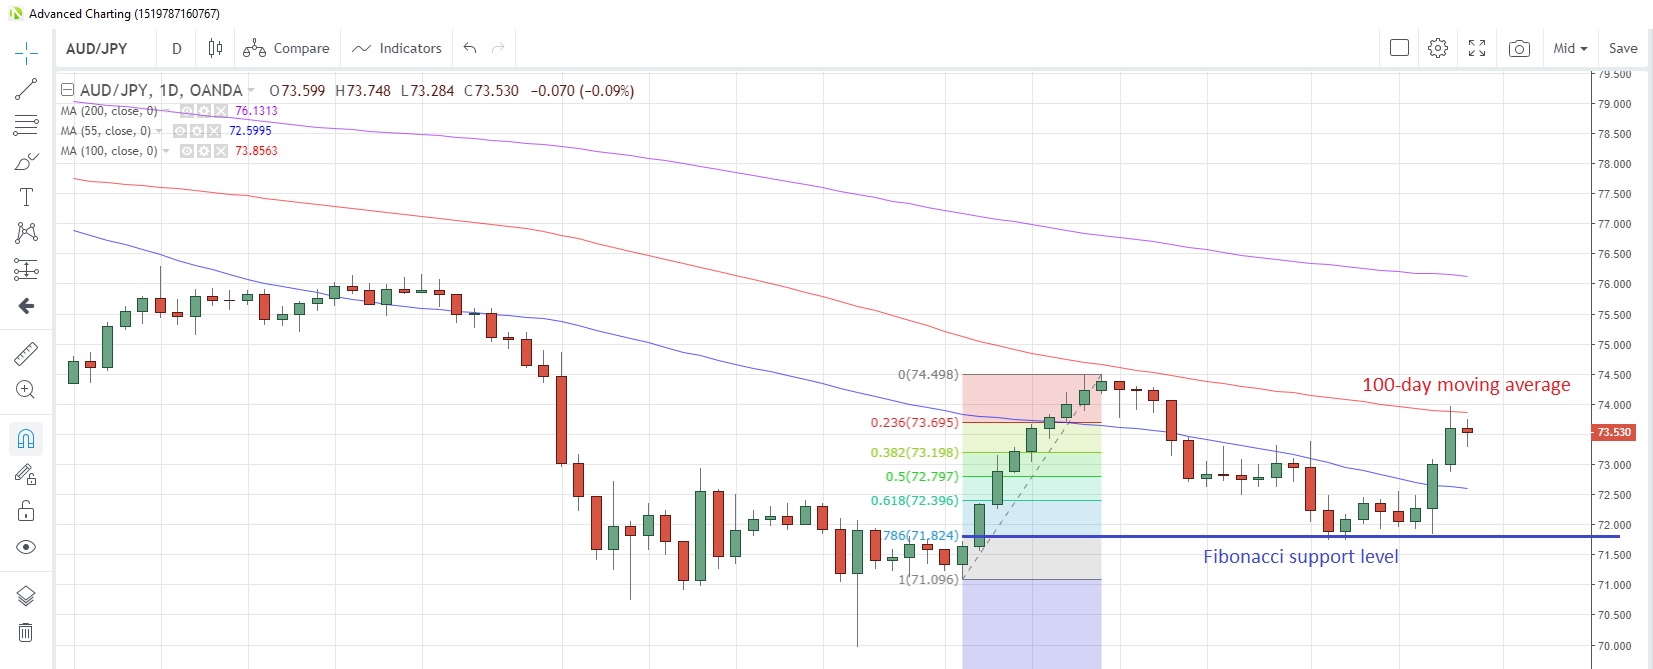
In reaction to the weak imports, the Australian dollar weakened across the board, dropping 0.1% to 0.6785 versus the US dollar and 0.15% to 73.49 against the Japanese yen. AUD/JPY remains capped near-term by the 100-day moving average, which was tested, but held on Friday. It has capped prices on a closing basis since April 23.
AUD/JPY Daily Chart
MAS eases as Singapore avoids technical recession
In its semi-annual monetary policy statement, the Monetary Authority of Singapore (MAS) said it will reduce slightly the rate of appreciation of the SGD NEER policy band. There was no change to the policy band and no re-centering of the NEER. This is equivalent to a marginal easing as the MAS using the exchange rate as its monetary policy tool, and was perhaps not as aggressive as market expectations.
In its economic forecasts, the MAS cut its headline inflation to about 0.5% from 0.5%-1.5% previously while the 2019 GDP growth forecast was trimmed to 0%-1% from 1.5%-3.5%. It stated the measured adjustment was consistent with medium-term price stability, given the current economic outlook. It remains ready to re-calibrate monetary policy should the need arise.
Earlier, data had showed that the Singapore economy had avoided a technical recession, with 0.6% quarter-on-quarter growth, well below expectations of 1.5% expansion but a positive reading after posting a 3.3% contraction in Q2 and a 3.4% decline in Q1.
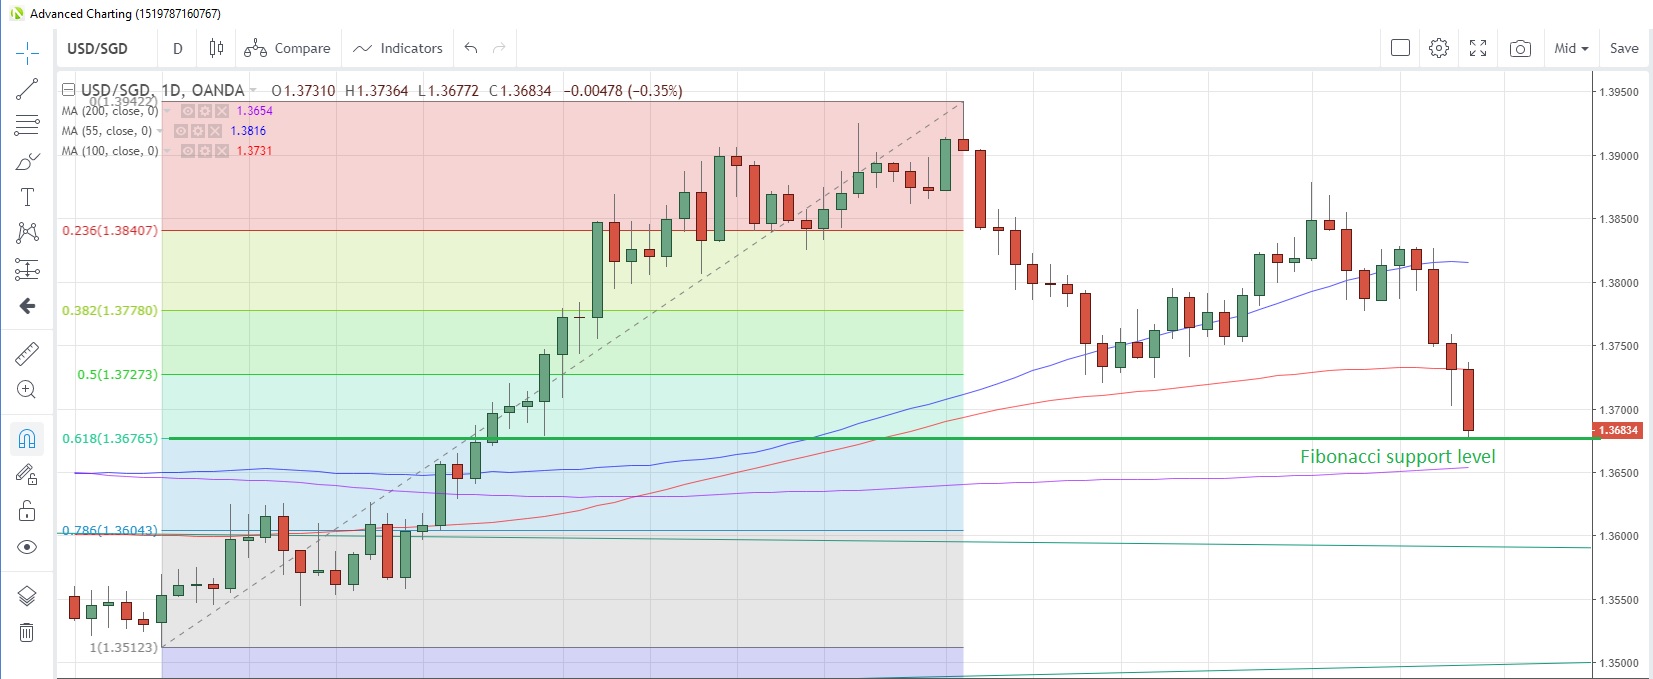
In response USD/SGD fell as much as 0.4% to touch 1.3677, the lowest since July 26, and is now trading at 1.3686. The 61.8% Fibonacci retracement of the July-September rally is at 1.3676 with the 200-day moving average below at 1.3654.
USD/SGD Daily Chart
Holiday-impacted calendar
Holidays in Japan, the US and Canada have kept the economic calendar quiet, with Euro-zone industrial production for August the only major item on tap. It is expected to show contraction for a fifth straight month with a -2.5% y/y reading, worse than the -2.0% seen in July.
Speeches from ECB’s De Guindos and Bank of England’s Cunliffe complete the day.
Related Articles

The BOJ’s policy shift continues to strengthen the yen, keeping USD/JPY under pressure. Rising Japanese bond yields signal further tightening ahead, reinforcing the bearish...

U.S. economic growth fears mount as data disappoints, weighing on USD European data surprises fuel optimism, boosting EUR/USD Bond markets signal diverging growth outlooks for...

CHF/JPY Forex Strategy is Bearish: We are currently @ 166.78 in a range. If we can break slope support, we are looking for a continuation to the ATR target @ 165.97 area, with a...
Are you sure you want to block %USER_NAME%?
By doing so, you and %USER_NAME% will not be able to see any of each other's Investing.com's posts.
%USER_NAME% was successfully added to your Block List
Since you’ve just unblocked this person, you must wait 48 hours before renewing the block.
I feel that this comment is:
Thank You!
Your report has been sent to our moderators for review


Add a Comment
We encourage you to use comments to engage with other users, share your perspective and ask questions of authors and each other. However, in order to maintain the high level of discourse we’ve all come to value and expect, please keep the following criteria in mind:
Enrich the conversation, don’t trash it.
Stay focused and on track. Only post material that’s relevant to the topic being discussed.
Be respectful. Even negative opinions can be framed positively and diplomatically. Avoid profanity, slander or personal attacks directed at an author or another user. Racism, sexism and other forms of discrimination will not be tolerated.
Perpetrators of spam or abuse will be deleted from the site and prohibited from future registration at Investing.com’s discretion.