- All Instrument Types
- Indices
- Equities
- ETFs
- Funds
- Commodities
- Currencies
- Crypto
- Bonds
- Certificates
Please try another search

Chart Of The Day: Yield Curve Signaling Recession Or S&P 500 Opportunity?

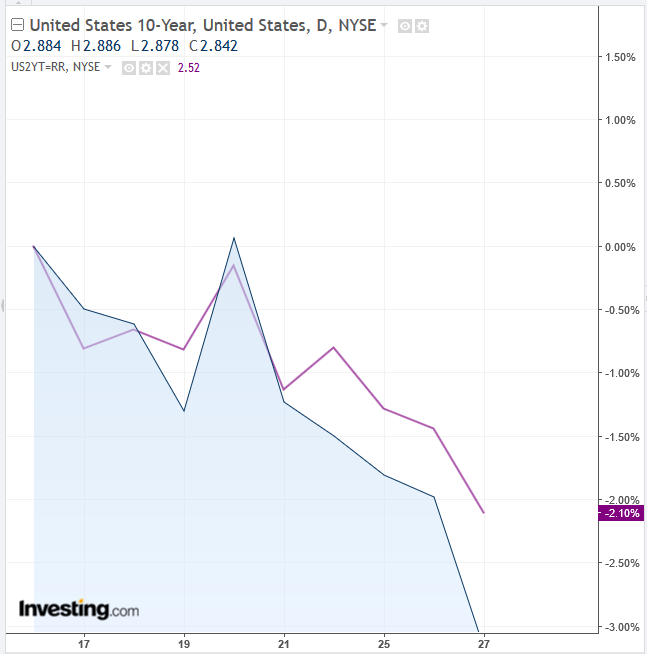
Buried beneath the unending trade war narrative, but squarely fueled by it, there's a clear signal from US Treasury yields currently flashing a huge, red flag. “Wall Street is worried that a flattening yield curve is close to predicting a recession,” says Barron's . Bloomberg adds “the trade war has sent the yield curve to its flattest since 2007."
The yield curve, a measure that compares the differential between the yield on short and longer term sovereign bonds—typically the US 10-year versus the 2-year Treasury notes—should normally be broad enough that longer term bonds have a better yield payoff than shorter term bonds. This would compensate investors for waiting longer to get their return on investment, as well as to make up for their exposure to higher inflation, which would erode their potentially outdated yields.

However when the yield curve flattens—with the potential for short-term rates to invert, thereby providing a higher yield than longer term notes—it suggests a dismal outlook for investors. That's because they wouldn't want to lock themselves in at current rates if there's the possibility of higher yields on the horizon.
At the same time, equity markets are becoming skittish. Last year investors needed to do nothing more than buy stocks, which were jumping. Right now however, between the geopolitcal headwinds and the lack of economic clarity, smart money is working overtime to try to figure out which assets will be most productive going forward.
We remain bullish on equities, but yesterday's US trading, in which the two main US benchmarks, the S&P 500 and the Dow Jones Industrial Average whipsawed between gains and losses but closed nearly flat, offered no clues. Investors might ask some or all of the following questions to help gain some clarity:
- Will global trade unhinge the first synchronized global growth since the last depression?
- Is the Fed tightening too quickly, especially now, when trade war headwinds are already providing risk?
- Should China’s seemingly shrinking economy, along with its equity market which is now officially in bear territory, be considered a leading indicator for the direction of global stocks?
- Or are US stocks more insulated, given the country's economy continues to expand as indicated by the lowest unemployment rate in 18 years, high consumer confidence and an outlook for a 4 percent GDP. Wouldn't all that drive more demand for US stocks, propelling prices higher?
Still, the continually flattening yield curve should give investors pause. With a 0.326 percent differential right now, the curve is at its narrowest since 2007 when the US economy was heading into what was arguably the worst recession in almost 80 years. As well, it should be remembered that every recession over the past 60 years was preceded by an inverted yield curve.
Nevertheless, we continue to maintain our bullish stance on equities.
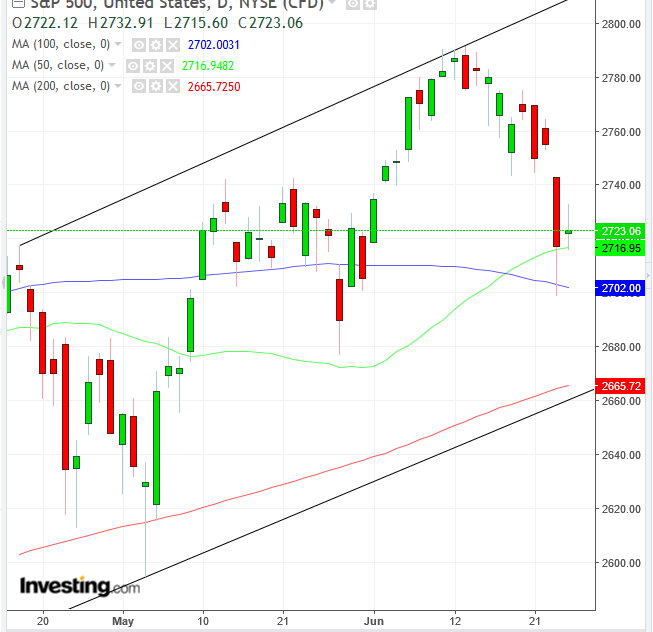
The S&P 500 is trading within a rising channel. The recent selloff occurred after it reached the channel-top. We therefore expected nothing more than a correction.
Yesterday’s High Wave candle, however, was good enough to remain above both the 50 and 100 DMAs. At the same time the 200 DMA is “guarding” the uptrend line since the February low. Therefore we consider the current uncertainty to be the precursor for a buying opportunity.
Trading Strategies – Long Position Setup
Conservative traders would wait for a full correction toward the uptrend line, or channel bottom, in order to witness a bounce that would confirm the uptrend, with at least one long green candle engulfing the preceding red or small candle of any color.
Moderate traders may wait to enter a long position either when it reaches the uptrend line, without waiting for a bounce, or for a bounce without reaching the uptrend line.
Aggressive traders may enter a long position now, with a stop-loss below yesterday’s low, beneath 2,700, counting on the 50 and 100 DMA and yesterday’s High Wave candle to signal a short term reversal, back toward the top of the channel.
Related Articles

The gold market is experiencing a period of "Gold Mania," with record-breaking prices and significant volatility. This excitement is reflected in the precious metal reaching an...

Stocks are climbing a wall of worry, which is a hallmark of bull markets. Higher equity prices really do require fear! Today we’ll highlight the least-liked stocks on Wall Street....

Three mega-cap names recently announced billions in share repurchase authorizations. Mega-cap generally refers to stock with market capitalizations of $200 billion or more. Below,...
Are you sure you want to block %USER_NAME%?
By doing so, you and %USER_NAME% will not be able to see any of each other's Investing.com's posts.
%USER_NAME% was successfully added to your Block List
Since you’ve just unblocked this person, you must wait 48 hours before renewing the block.
I feel that this comment is:
Thank You!
Your report has been sent to our moderators for review


Add a Comment
We encourage you to use comments to engage with other users, share your perspective and ask questions of authors and each other. However, in order to maintain the high level of discourse we’ve all come to value and expect, please keep the following criteria in mind:
Enrich the conversation, don’t trash it.
Stay focused and on track. Only post material that’s relevant to the topic being discussed.
Be respectful. Even negative opinions can be framed positively and diplomatically. Avoid profanity, slander or personal attacks directed at an author or another user. Racism, sexism and other forms of discrimination will not be tolerated.
Perpetrators of spam or abuse will be deleted from the site and prohibited from future registration at Investing.com’s discretion.