Electronic Arts Inc. develops, markets, publishes and distributes game software content and services that can be played by consumers on a variety of video game machines and electronic devices (platforms).
This is a quick vol note, specifically a calendar spread I noticed – but with a twist. The back month has earnings (a vol event) embedded in the options.
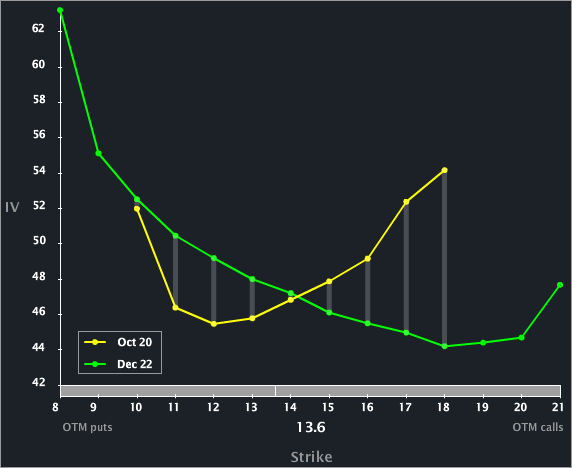
Let’s start with the Skew Tab from today to examine the line-by-line and month-to-month vols.
Note that I have excluded the September options and am only focusing on the October and December expiries. We can see that the ATM vols (13 and 14 strikes) are depressed in October relative to December. But, as we walk further up the skew, we can see that the OTM calls in October are in fact priced higher than the OTM calls in December (in terms of vol).
The tricky thing here is that the next earnings release for EA should be at the end of October but outside of October expiry. In English, the December options have a vol event that October does not, yet the OTM calls in December are less expensive (in terms of vol) than the OTM calls in October. And that, is a fancy little trick.
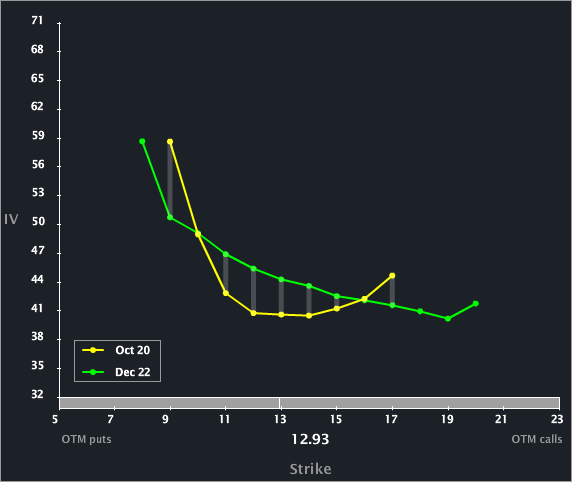
I took a look back at the historical skew for EA and as late as 8-27-2012, the skew shape did not exhibit this phenomenon. I have included that Skew Tab, below.
While there’s a hint of higher vol in the 17 strike, for the most part, all of October lies below December – which is expected, given the earnings event.
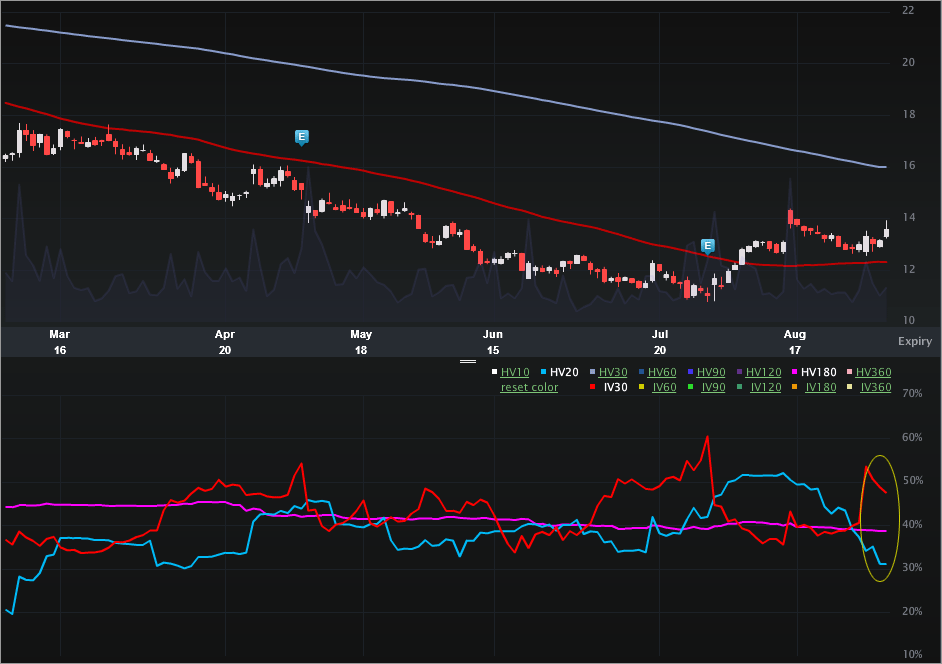
Let’s turn to the Charts Tab (six months), below. The top portion is the stock price, the bottom is the vol (IV30™ - red vs. HV20™ - blue vs. HV180™ - pink).
On the stock side we can see how EA was in a bit of a free fall for the four months ending in late July. Since hitting a closing low of $11.02 on 7-31-2012, the stock is up 23.4% as of this writing – so a nice rebound.
On the vol side we can see how the implied rises and falls with earnings, which is normal. But more recently we can see that spike in the IV30™ and then a bit of a dip. On 8-24-2012 the implied closed at 38.16% and rose to as high as 53.59% (a 40% rise) one week later. The IV30™ has dipped since then to 47.62%, but it’s still elevated to that 8-24-2012 level and is certainly elevated to the historically realized measures (HV20™ and HV180™. The 52 wk range in IV30™ for EA is [33.66%, 63.17%], putting the current level in the 47th percentile.
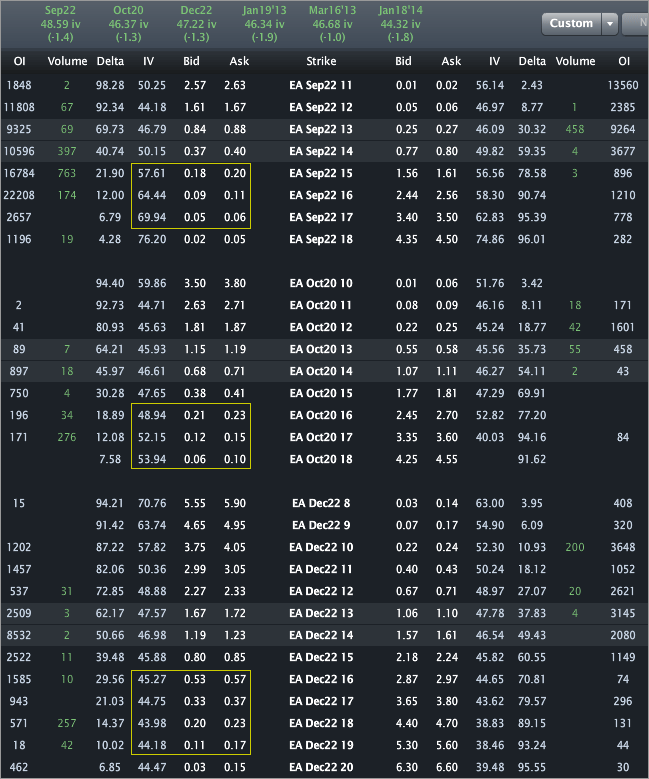
Finally, let’s turn to the options Tab for completeness.
Across the top we can see that October vol is priced to 46.37% while December is priced to 47.22%. But, as we saw in the skew chart, moving to the OTM calls, we can see that the vol in October is above December. In fact, that same phenomenon exists in September.
As just one example, we can see on the 17 strike vols of 69.94%, 52.15% and 44.75%, respectively for September, October and December. An interesting position to analyze would be the September/December OTM call spread, then if September expires worthless, to roll that into an October/December call spread, all the while owning cheaper vol than selling while owning the earnings event. Just to be clear, I’m not recommending this trade, I’m pointing out a cool vol phenomenon, namely OTM call elevated vol outside of earnings relative to an expiry with earnings.
Disclaimer: This is trade analysis, not a recommendation.
- English (UK)
- English (India)
- English (Canada)
- English (Australia)
- English (South Africa)
- English (Philippines)
- English (Nigeria)
- Deutsch
- Español (España)
- Español (México)
- Français
- Italiano
- Nederlands
- Português (Portugal)
- Polski
- Português (Brasil)
- Русский
- Türkçe
- العربية
- Ελληνικά
- Svenska
- Suomi
- עברית
- 日本語
- 한국어
- 简体中文
- 繁體中文
- Bahasa Indonesia
- Bahasa Melayu
- ไทย
- Tiếng Việt
- हिंदी
Calendar Vol Diff Opens, But What About Earnings?
Published 09/07/2012, 05:13 AM
Updated 07/09/2023, 06:31 AM
Calendar Vol Diff Opens, But What About Earnings?
Latest comments
Loading next article…
Install Our App
Risk Disclosure: Trading in financial instruments and/or cryptocurrencies involves high risks including the risk of losing some, or all, of your investment amount, and may not be suitable for all investors. Prices of cryptocurrencies are extremely volatile and may be affected by external factors such as financial, regulatory or political events. Trading on margin increases the financial risks.
Before deciding to trade in financial instrument or cryptocurrencies you should be fully informed of the risks and costs associated with trading the financial markets, carefully consider your investment objectives, level of experience, and risk appetite, and seek professional advice where needed.
Fusion Media would like to remind you that the data contained in this website is not necessarily real-time nor accurate. The data and prices on the website are not necessarily provided by any market or exchange, but may be provided by market makers, and so prices may not be accurate and may differ from the actual price at any given market, meaning prices are indicative and not appropriate for trading purposes. Fusion Media and any provider of the data contained in this website will not accept liability for any loss or damage as a result of your trading, or your reliance on the information contained within this website.
It is prohibited to use, store, reproduce, display, modify, transmit or distribute the data contained in this website without the explicit prior written permission of Fusion Media and/or the data provider. All intellectual property rights are reserved by the providers and/or the exchange providing the data contained in this website.
Fusion Media may be compensated by the advertisers that appear on the website, based on your interaction with the advertisements or advertisers.
© 2007-2024 - Fusion Media Limited. All Rights Reserved.
